I’ve been in lots of conversations over the years about whether it’s the teacher’s role to fight our society’s built-in racism. Is it our role to even the scales of justice, and if so, how? The immensity of the question can be an impediment to talking about it. Folks, myself included, get especially bogged down in the how part. Some teachers feel more constrained than others by the sense that our communities hire us to perform a role that properly plays out at the level of the individual student or class; leveraging our position to achieve society-wide change is outside the boundaries of our mandate.
There are lots of aspects of anti-racism work. I have a lot to learn about it. And I do keep my social advocacy out of the classroom for various reasons, one of which is that I think the community that employs me expects me to prioritize equity and justice in my room but be basically neutral in my in-school stance toward society. I don’t see how I can teach through data sets and story problems that are clearly advocating for various social positions. But –
But something’s crystallized in my thinking over the last year and a half: a way to explain why identity work – devoting classroom time and energy to surfacing and appreciating students’ multifaceted identities – is inseparable from the mathy part of math instruction. What happened was that my family has, over the last 18 months, watched an absolute crap-ton of BBC nature documentaries.
Yes, the footage in Blue Planet is captivating, and it’s tightly woven into great “plots” for each episode. But (especially if you’re watching with your eyes glazed over from a long week) you can’t help but wonder how much of the effect comes from that classic BBC voice of David Attenborough, exuding omniscience as the camera visits places and moments that seem utterly impossible.
As a white man, I guess it took me longer than it should have, but eventually it dawned on me to wonder: how much work in this presentation is being done by Attenborough’s accent and authoritative male voice? How would this show present differently – to me, to BBC executives, to other viewers – if it weren’t narrated in the accent that represents society’s default sound of expertise?
As math teachers, our academic mandate is to help students learn to sort valid from erroneous reasoning, fact from falsity. To the extent that our students are evaluating propositions not based on their logic but rather based on the voice or appearance of the speaker, then they’re not developing the habit of thinking mathematically. The essence of mathematical thinking is to be extremely clear about our certainty – what do we know, what do we conjecture, what follows from those conjectures? There’s simply no room for being swayed by someone’s voice.
Students need our help to develop this habit of evaluating propositions based on content, not style. They need it whether their first instinct on a math question is usually correct and full of conviction, or wavering and full of questions. In the former case, the student may not be able to recognize correct propositions raised by others if they’re spoken hesitantly or with a voice less associated with expertise in our society. In the latter case, the student may not be able to recognize correct ideas in their own heads, if they’ve learned that expertise cannot possibly sound like their voice, their accent, their diction.
I’m late to this realization, having taught math now for 16 years. But students really can’t reason mathematically when they think math must sound like a white man talking confidently. Of course, I knew that all along. But I happened to be watching all that BBC in the same year I’d made progress learning to use visibly random groups and wall whiteboards (VNPS’s). And noticing the difference it made when students got used to the sound of math spoken in their own voices made me realize how deeply the mathy part of successful math education depends on identity work.
There’s more to the teacher’s role, of course. For starters, understanding that a broken society causes some students to have trouble investing in systems that seem designed to oppress rather than uplift, and understanding that math class may initially be perceived as part of those systems. I don’t blog about that, because I’m not sure how you can blog about relationships and authenticity. But we have our work cut out for us, come fall.
(Update 7/3/20: in the first paragraph, I didn’t mention advocating for anti-racist changes within one’s school or school district. Those are definitely within the purview of a teacher. My point is that when teachers speak out as teachers in favor of better schools, it’s different than teachers speaking out as teachers on economic policy, health policy, etc.)
Since Desmos gave everyone access to Computation Layer, I’ve been loading up my home-built activities with CL to get those ✔️ and ✖️ symbols to show up in the dashboard.
Unfortunately, there’s a problem with the dashboard. It happens on any kind of randomly-generated practice that rotates students through different problem-types. Even if you and I both have a ✔️ for Screen 1 and a ✖️ for Screen 2, we might actually have opposite skill profiles. This would happen anytime the question I got on Screen 1 is the type of question you got on Screen 2 and vice versa. Looking at the dashboard doesn’t tell the teacher how to help either of us.
This is disastrous for teachers who want to intervene quickly during the activity rather than via some kind of later pull-out. A typical activity is maybe 20 minutes. I want to spend all 20 minutes helping students who are getting stuck. Those 20 minutes are precious — they’re when the questions are actually arising in student’s minds…when the students actually feel the “headache” for which a little idea might be the aspirin, as Dan Meyer likes to say. I want to spend as little time as possible figuring out who needs what kind of help.
That doesn’t mean I plan to march over to the student’s desk and start talking at them. Once I know who needs help, I might carefully look through a bunch of their screens to “listen” to their thinking, and then go to their desk and actually listen to their thinking. But I want very little friction in identifying where to start.
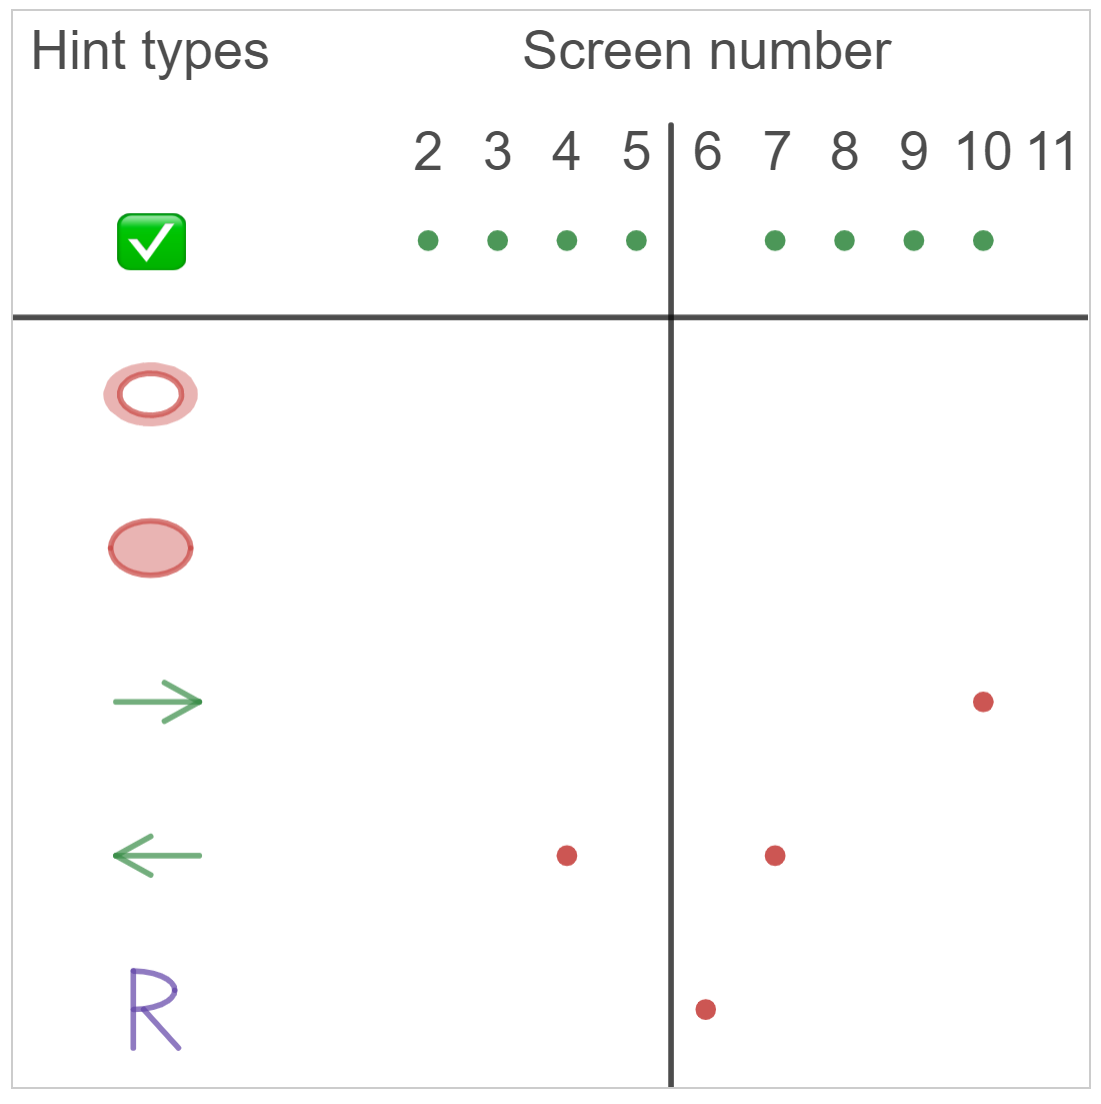
This summer, with help from @mrchowmath, I created a dashboard that tracks which errors students are making on each screen, not just which screens are correct. (This doesn’t mean that Desmos endorses my dashboard, just that I’m grateful for Jay’s help). The screenshot below shows the dashboard being used in a Function Domain activity. Students are given a randomly-generated graph and must type an inequality representing the domain. This screenshot is for Ian, a fake student. It tells a specific story about what Ian knows. He can represent domains for graphs with circles as endpoints (like 2<x<5), but he struggles anytime the graph has an arrow on the end (like x>1). Can you see how Ian’s dashboard shows tells this story?
Ian’s Dashboard
The red dots show that, on Screens 4 & 7, Ian made the error of thinking a graph ended at a left-facing arrow (instead of continuing to negative infinity). On Screen 10, he made the same mistake with a right-facing arrow. And on Screen 6, he made the same mistake when arrows were on both ends (when the correct domain was “All Real Numbers”, hence the symbol R). The lack of a green circle along the top for Screen 6 shows that Ian gave up and never got the right answer for that screen — he simply moved on to Screen 7. He did fix his errors on all the other screens, but has not yet completed Screen 11 (there is no green dot for 11). If a student had very few green dots along the top, that would mean they’re really struggling.
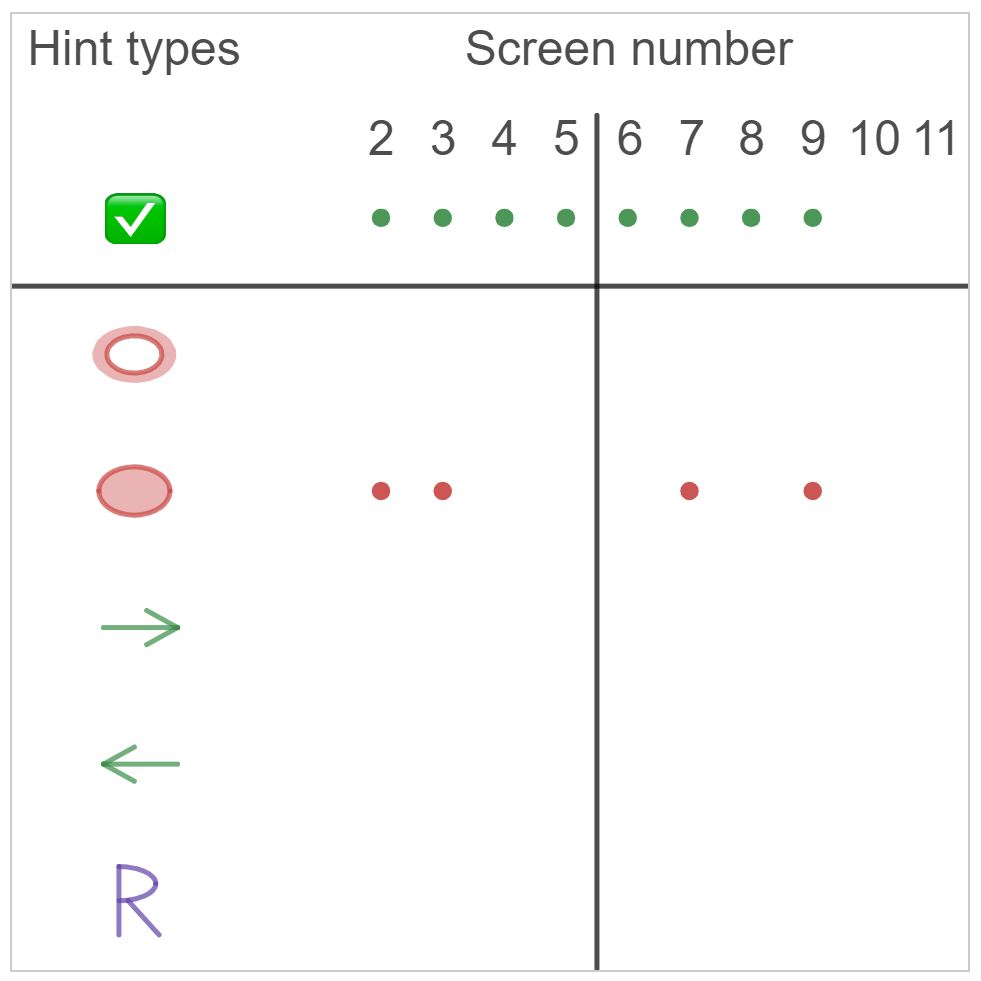
Marian’s dashboard, below, shows that unlike Ian, she does understand arrows. But she consistently forgets to put the “or equals to” part of a > or < symbol, so she makes lots of mistakes on problems with closed-circle endpoints.
Marian’s Dashboard
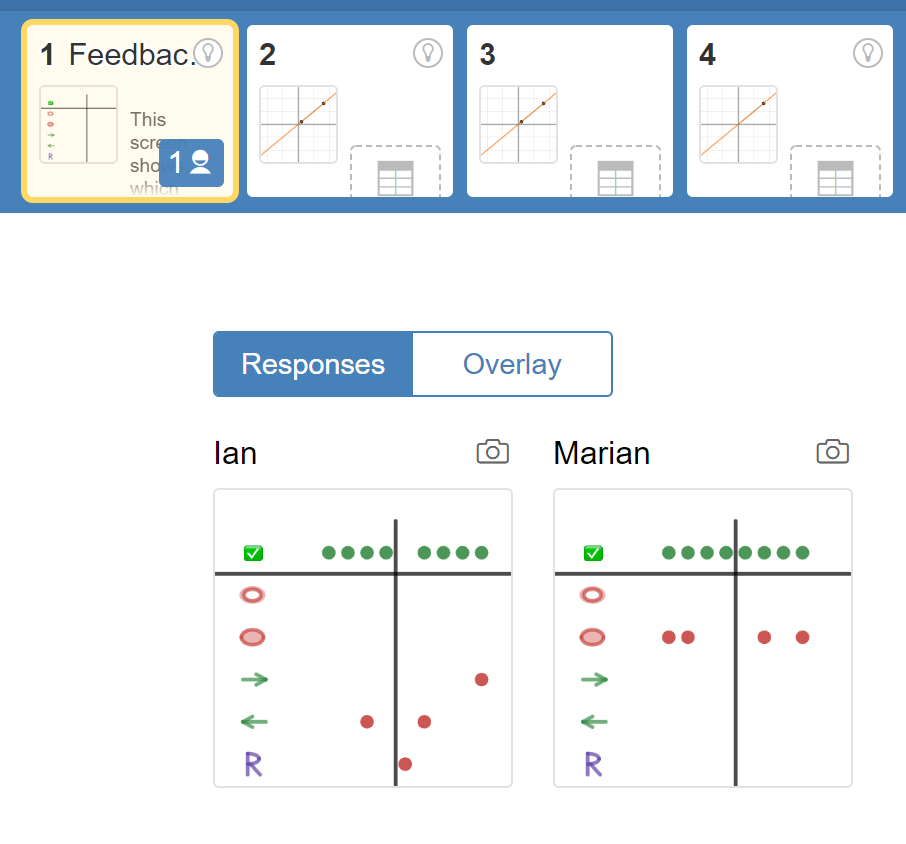
Meanwhile, the teacher view shows everyone’s dashboard at once. It uses the “response tiles” in the Desmos teacher view. For example, here are Ian and Marian’s at the same time:
Teacher View
Here’s a quick video showing how the dashboard works.
The domain and range activities that house the dashboard probably deserve their own blog posts, but that’s unlikely to happen, so I’ll link to them here. I worked super hard to make them give students useful feedback as they work. The CL identifies common mistakes and responds with actually useful prompts, rather than just saying “try again” all the time.
Domain Intro (including parts of Desmos-authored lessons).
Domain-only Infinite Practice (with dashboard). Every time you create a new class code for this activity, students will get new problems when they log in. And each student gets different problems from the other students.
Here are 3 things you can teach a 4-year-old (they’re real parts of Montessori pre-K) :
How to tie shoelaces
How to polish leather shoes
How to sew with needle and thread.
If you were designing a curriculum for 4-year-olds and you wanted to make a unit containing two of these topics, which two would you group together? Your choice says a lot about your perspective.
If you frame the unit from a functional perspective, you’ll group skills together based on when we use them. Shoelace-tying and shoe-polishing both relate to shoes that are fancier than a 4-year-old typically wears, so you might group them together with the theme of “Getting dressed up!” and plan some kind of fancy footwear party as a culminating activity.
We group topics functionally all the time in Algebra 1, too. For example, we have three different tools for solving systems of linear equations: graphing, substitution, and elimination. Since these three tools have related functions — they help us solve similar types of problems — we group them together in a single unit.
The problem with grouping functionally is that topics that are closely-related according to when we use them may be only distantly-related in their rationale, or in the steps students must follow to implement them.
Let’s go back to the 4-year-olds for a minute. Tying shoelaces and sewing with needle and thread aren’t related functionally, because real-life situations in which we need to tie shoes don’t overlap much with situations requiring sewing. But they do involve very similar student actions: fine motor control of strings. If you create a unit based not on the expert perspective (“When will I use these skills after I’ve learned them?”) but instead on the novice perspective (“What am I focusing on while I’m learning these skills?”), then I think you’ll group shoelace-tying and sewing together.
I believe most Algebra 1 curricula ignore the novice perspective, leading to units that don’t feel to students like they have any internal connectedness. This is a huge factor in students’ sense that math is a meaningless collection of separate skills.
Today I’d like to share an Algebra 1 unit on expressions and equations that goes deeper than beginning-of-year units generally go, while also giving students a sense of connectedness by sticking to the novice perspective. For comparison, let’s first take a peek at the traditional back-to-school Algebra 1 unit.
The traditional way
Take a look at the hodgepodge of topics in the first standard in Virginia’s curriculum. If this doesn’t show you what a conceptual mess can be made by adopting the functional perspective, I don’t know what will. The skills needed to master these topics are almost completely unrelated to each other. Everything in black is a direct quotation from the standards, and notes in red are my clarifying notes.
A.1.a: “Translate verbal quantitative situations into algebraic expressions and vice versa.”
This means taking a description like “The sum of 4 and the product of 5 and three less than a number” and turning it into 4 + 5(x-3).” Ugh. This is essentially a grammar lesson about parsing the math version of how people get to know each other at family reunions: “Okay, so your parents are Aunt Betty’s son’s daughter and the grandson of the sister of my grandfather. ” The hard part is just diagramming the sentences in your mind.
A.1.b: “Model real-world situations with algebraic expressions in a variety of representations (concrete, pictorial, symbolic, verbal).”
This means comprehending a situation like “Ed has saved $40, and he saves another $10 per week” — and knowing how to translate it into an expression like 40+10w. It’s a conceptual topic.
A.1.c: “Evaluate algebraic expressions for a given replacement set to include rational numbers.”
E.g., substitute x = -3/4 into 100 – 2x2 . This is a drill topic that can be taught with or without comprehension.
A.1.d: “Evaluate expressions that contain absolute value, square roots, and cube roots.”
E.g., substitute x = -5 into -2|x – 3|. Another drill topic.
So we have a unit about (a) reading the weird grammar of math expressions written verbally, (b) comprehending real-life situations and representing them with math, (c) substituting numbers into basic expressions, and (d) substituting numbers into more complicated expressions. If you squint real hard, you can see how these fit into a coherent unit. Do you see it? Each bullet point uses the word “expressions.” That’s it. That’s the rationale!
Let’s consider that from a novice perspective. When students are substituting -3/4 into the expression 100 – 2x2, are they thinking, “This is a problem about an expression,” or are they thinking, “Remember to put the -3/4 in parentheses?” Since they’re thinking about what they’re supposed to do, these topics feel like they have almost no coherent theme. You might argue that (b) does logically follow (a). That is, since Ed has already saved $40 and saves another $10/week, students might start thinking, “Aha! So Ed’s savings will be 40 more than the product of 10 and the number of weeks.” But of course no kid would think that way. It’s an expert perspective.
You might say that at least goals (b), (c) and (d) fit well together as different aspects of the order of operations. But this early in Algebra 1, any real-life situations we cover will be modeled by a very simple linear expression, like 40+10x. For expressions this simple, the order of operations thinking that students do is basically trivial. The difficulty lies elsewhere (in the fact that story problems are always hard for kids to interpret). In contrast, the expressions in goals (c) and (d) are advanced order of operations questions involving multiple operations inside and outside square roots, cube roots, absolute values, etc. There is very little overlap in student thinking between the topics.
Teaching from a functional perspective isn’t always wrong
The functional perspective emphasizes when we use skills, not how we apply them or why they make sense. Let’s go back to the example of the typical unit on Linear Systems. By grouping together the skills of solving by substitution, elimination, or graphing, the unit communicates that these methods perform the same function, even though the steps that students follow to apply each skill are totally different.
Linking concepts based on when we use them is important, but I’d argue it’s best for tying skills together after you’ve taught them.
Simply put: we should design students’ first foray into each concept around why it makes sense or how we work with it; once the concept has been mastered, we should connect it to other concepts based on when we apply them.
Is this the way your district teaches?
In Virginia, I think it’s much more common to see a straight functional perspective through the whole year.
One caveat: topics with similar meanings or procedures shouldn’t always be taught together. Sometimes you need to spread them out over several months. This is especially true when they rely on a tough idea or a tricky procedure — you may want to give the first topic time to mature in students’ minds before advancing to other levels of the same kind of thinking. Even here, though, we’re assiduously focusing on how the class feels for novices: are their brains ready to continue this topic, or is the introduction still cooking in their heads?
At all costs, we need to prevent classes from feeling like this:
Too often school is like a parade – a series of lessons – followed by a test to see how well the crowd paid attention to the parade.
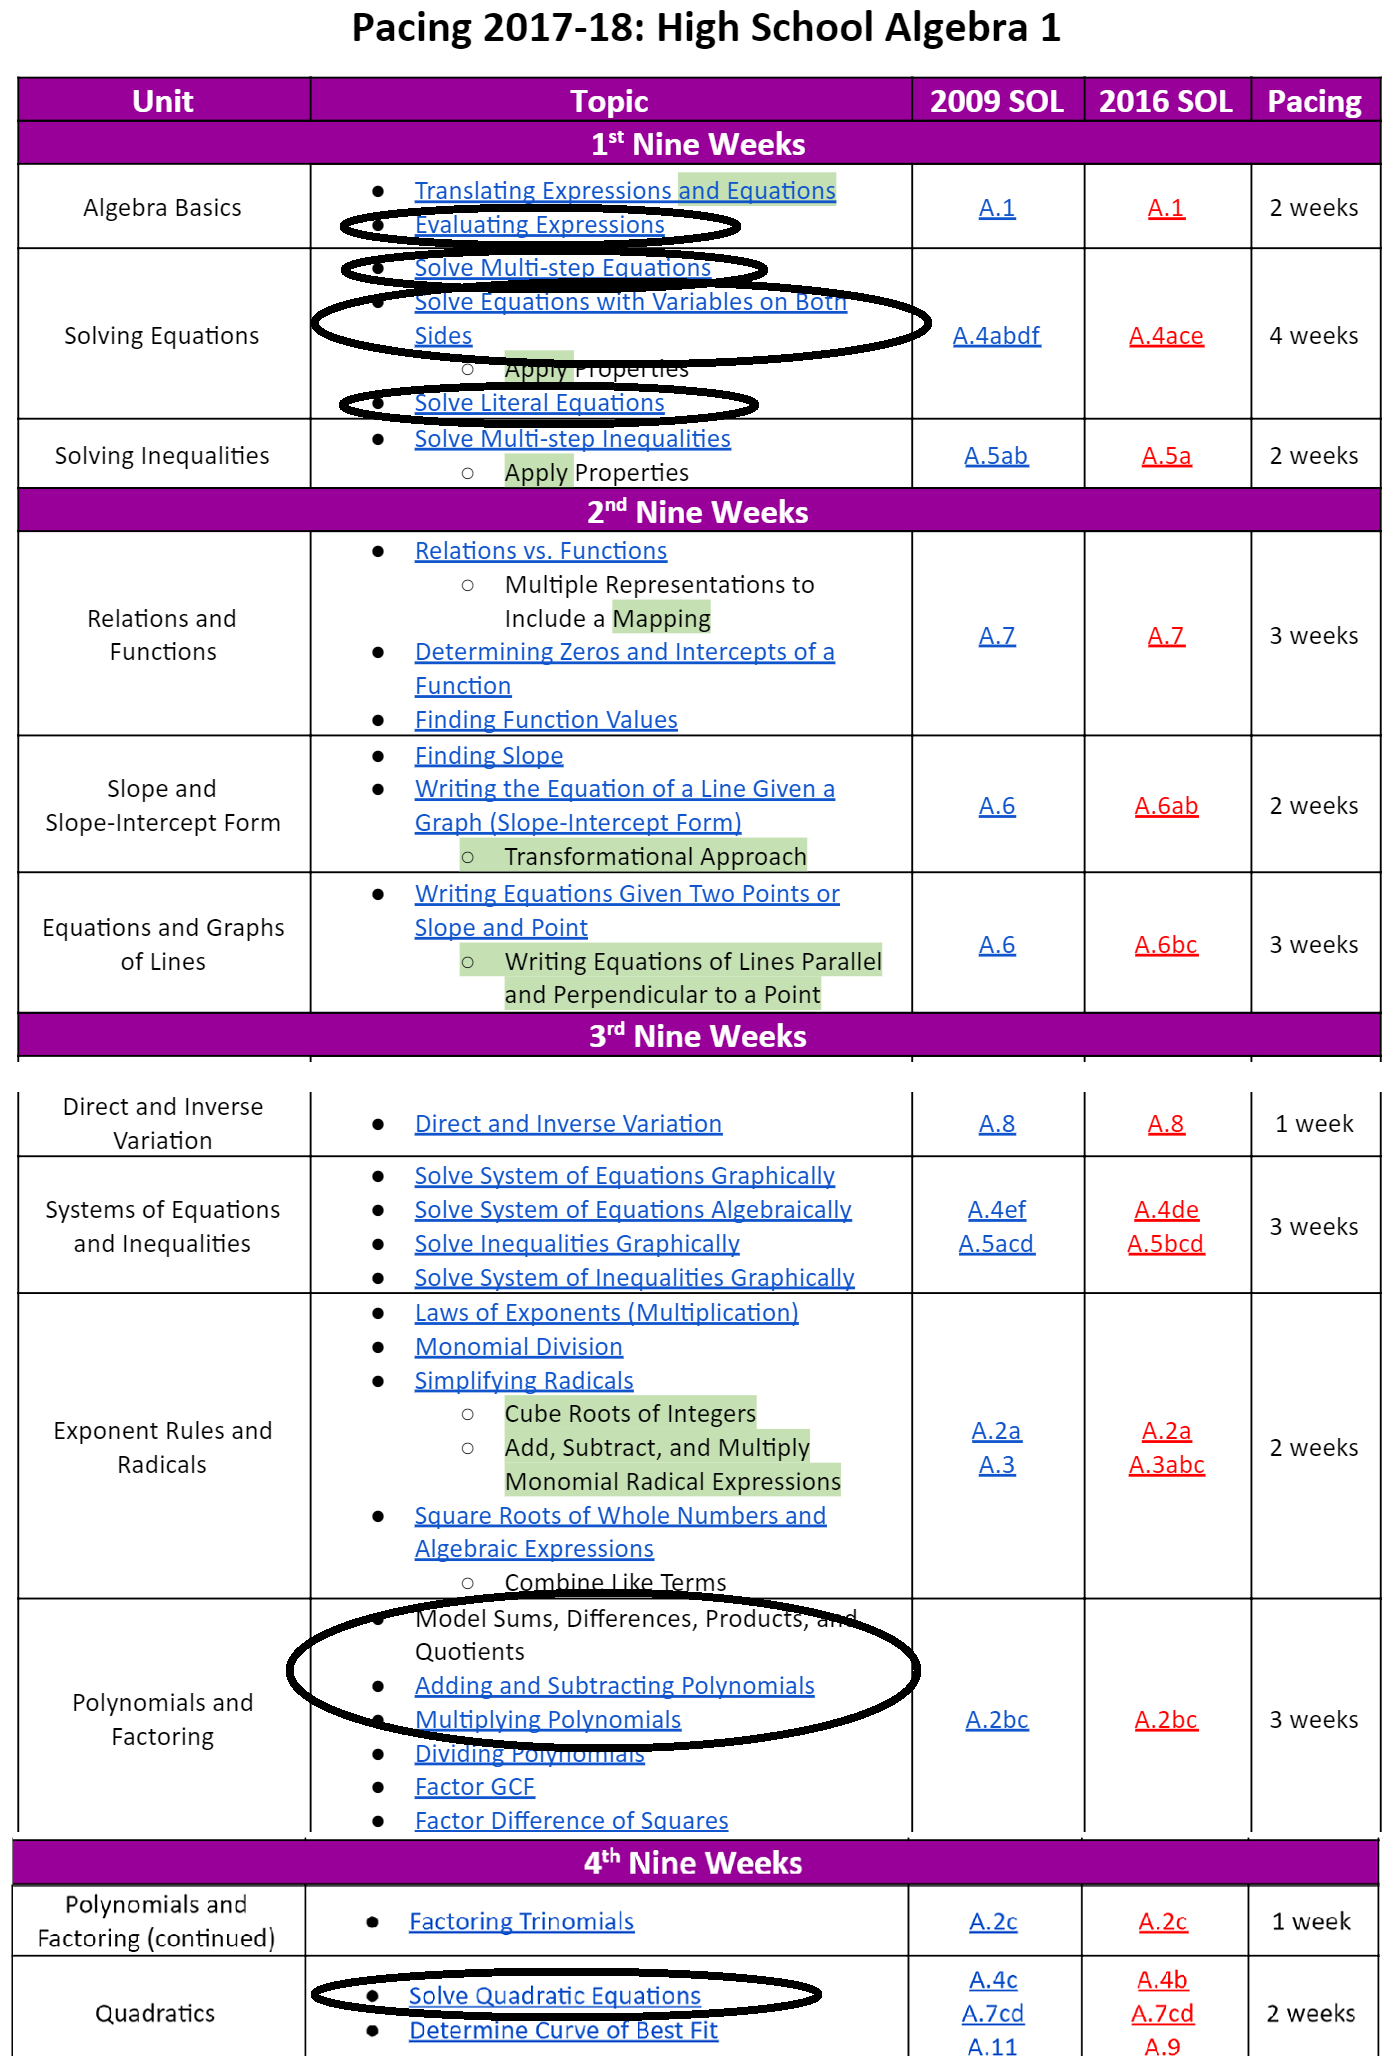
If you’re still reading, it’s time for the goodies: an Algebra 1 unit that cuts across the traditionally-defined units in order to create a more coherent feel. Below I’ve circled the topics included. They’re shown against the background of the pacing guide of Henrico County, VA, to highlight how the unit cuts across traditional topics. (I don’t work in Henrico, but I do appreciate how much stuff they post online).
Here’s a quick overview of the unit:
The first half of the unit flows from the order of operations without grouping symbols, emphasizing the role of exponents.
-52 versus (-5)2. Although most students won’t learn about using the ± sign with quadratic equations until 4th Quarter, advanced students will be able to learn it at the end of this unit. So the beginning of the unit prepares them by showing that there are two different solutions to (…)2=25. Meanwhile, learning the difference between -52 and (-5)2 gives everyone the conceptual basis for the next topic, below.
Substituting negative or fractional values into expressions. Because of what we learned in the previous topic, you have to substitute negative values in parentheses, right? Here we practice that skill and even practice subbing possible solutions into quadratic equations to check which ones are correct.
Adding and subtracting polynomials. As you’ll see below, this topic emerges naturally from the previous one. We use Desmos-based algebra tiles. The Desmos ones let us focus on the main idea more easily than physical tiles do. Activity links are below.
Regular combining like terms problems, with distribution. This is just an extension of adding and subtracting polynomials.
The second half of the unit flows from the order of operations with grouping symbols (except solving-by-balancing, which provides a brief, intentional pause in the conceptual progression).
Multiplying binomials. This is also taught with Desmos algebra tiles.
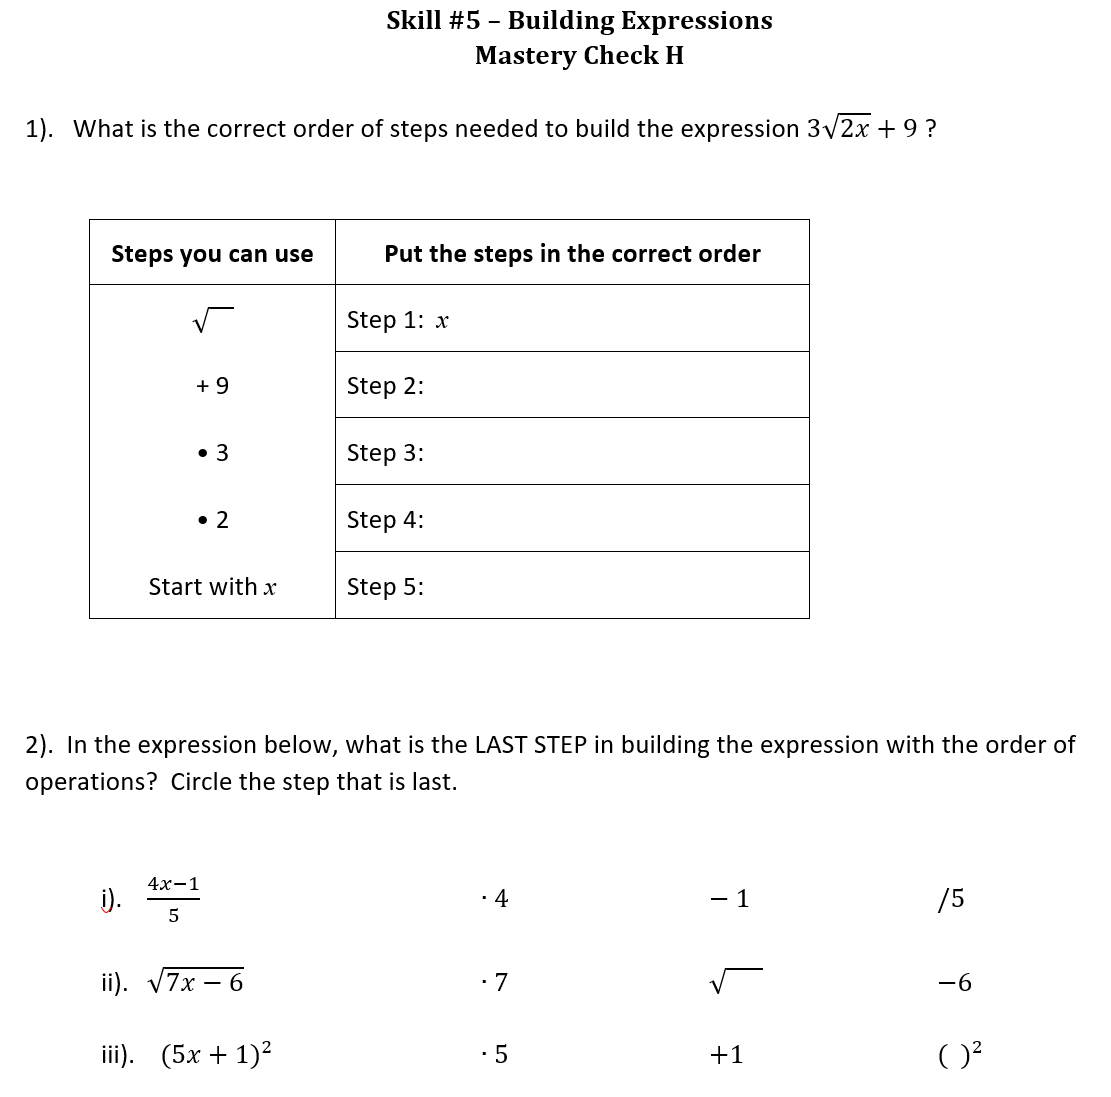
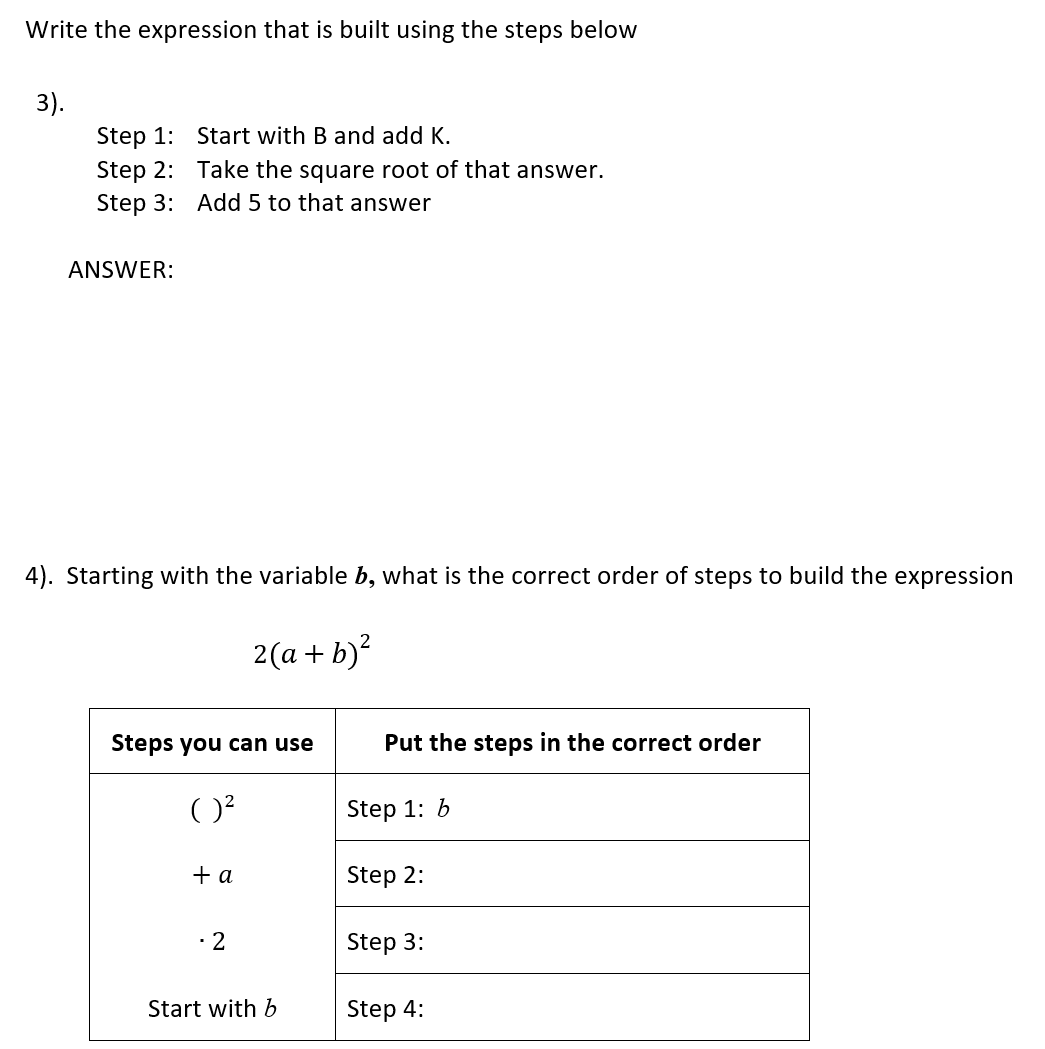
Building expressions with the order of operations. E.g., what expression represents starting with x, adding 3, squaring that result, and then dividing by 5? This topic includes literal expressions.
Solving equations by balancing. This also uses algebra tiles, though this time they’re physical ones. (By now, students understand them well enough that they’re quite helpful). Your students can draw pictures if you don’t want to use physical tiles.
Solving literal and nonlinear equations by unwinding. Now we reverse the order of operations to isolate x. This includes solving quadratics by taking square roots, but also solving easy radical equations and solving literal equations.
The unifying theme
The order of operations binds this unit together — it’s the basis for how we evaluate expressions, combine like terms, and solve equations. I don’t think most curricula highlight that connectedness, though. And I don’t think students in most classes realize that all of these topics emerge from a single, simple rule.
One particular aspect of the order of operations serves as a recurring motif for the unit. It’s this:
In an expression like 3x2, the order of operations says the (…)2 comes before the •3.
Hopefully, the unit feels like a spiderweb made of many threads but arranged into a coherent whole. If so, expressions like 3x2 are the stickiest thread. Early in Algebra 1, students’ experiences with x in math are almost entirely with linear terms. When they see something like 3x2, their eyes gravitate toward the familiar part, 3x, and treat it as a unit. Their eyes perceive the (…)2 as secondary, and that means they often interpret 3x2 completely wrong. This unit is designed to give students a chance to get caught on this sticky thread over and over until their brains are ready to see 3x2 for what it actually means.
Quadratics in 1st Quarter?
It’s very unusual to include polynomials and quadratic equations in the 1st quarter of Algebra 1. What could possibly justify doing that? Well, quadratics is the hardest unit for most students. It includes these 5 topics:
Factoring trinomials
Advanced factoring (e.g., factoring out a GCF first)
Solving quadratics:
by factoring
by taking square roots (and using the ± sign to get both solutions)
with the quadratic formula
Knowing which solving method to apply when
Parabolic graphs
From the novice perspective, grouping these topics together is a disaster because the skills related to factoring feel very disconnected from the other skills. This disconnect is hugely meaningful. It’s an idea that undergirds not just this unit but also the rest of high school math: when an equation includes terms of different degrees (like x2 and x), then there’s no way to isolate x, so we have to solve by applying the zero-product property. How foundational is this? Well, the phrase “Fundamental Theorem of Algebra” comes to mind, right? We cannot let students finish Algebra 1 unclear on why suddenly in April, when we have just come back from spring break and are starting to think of long summer days of video games and Netflix, we randomly decided to invent a crazy-complicated technique like solving by factoring. We cannot let students decide that it’ll be okay just to ride out the year and get those questions wrong on the final exam. And we don’t want students to be overwhelmed by the difference between solving by factoring and the other methods…we want that difference to provoke a fundamental shift in thinking.
So I’m moving solving by square roots all the way up to 1st quarter while saving factoring and the quadratic formula for 4th quarter. That way when students see 1+(x+4)2=0 and x2+5x+4=0 side-by-side in 4th quarter, they’ll recognize that the first equation is just another example of solving-by-undoing, but the second equation is radically different and will require a new technique. Unless the first equation looks familiar and the second looks weird and somehow wrong, that recognition won’t occur. It’s also really good to teach multiplying binomials early in the year, because then the skill has automaticity by the time students attempt to reverse it when they learn factoring.
In first quarter, I’ll teach just how to get one solution to 1+(x+4)2=145, without using the ± sign. Then in 4th quarter, we’ll teach the ± sign part and connect it to the two zeros of a parabola. This approach doesn’t just pay dividends in 4th quarter. It also makes 1st quarter more meaningful and interesting from a novice perspective, because solving by taking square roots is so similar to solving literal equations. Both are aspects of the order of operations — they belong together. And only when students form connections like this can they experience math as making them powerful.
There and back again: a journey through the order of operations
Here’s a detailed look at the unit, with links to key materials:
Topic 1: -52 versus (-5)2.
Why does -52 have a negative value, while (-5)2 has a positive value? Because (-5)2 means (-5)(-5), but -52 means -1•52. And in expressions like -1•52, you do the exponent first, so there’s only one negative sign, not two. This is the sticky spider web thread highlighted above.
An even number of negative signs produces a positive answer, but an odd number of negatives makes a negative answer. So would the following values be positive or negative: -5120 , (-5)120 , and (-5)121 ?
What about questions implicitly relying on exponent rules, like (-5)3•(-5)15 ? Even without having been taught exponent properties, students can see that this will have 18 negative signs, so it will be positive because 18 divides evenly into pairs. Our spiderweb has caught some prey: the intuition of exponent rules! We’ll eat this prey in Topic 4’s extension.
Topic 2: You must substitute negative values and fractions in parentheses.
To evaluate x2 + 5x for -3, you need parentheses: (-3)2+5(-3). That’s because (-3)2 is not the same as -32, as we learned in Topic 1.
To evaluate it for 2/3, you also need parentheses: (2/3)2+5(2/3), for the same reason.
You can check solutions to quadratic equations by substituting them correctly. For example, to check whether -1 is a solution to x2+5x+4, you can evaluate (-1)2+5(-1)+4. Remember to use parentheses.
Extension for advanced students:some students can now begin trying to guess both solutions to equations like 2+(x+4)2=27. Guessing the answer x=1 is easy, but guessing the answer -9 takes thinking. This lays the groundwork for an extension in Topic 9.
Commentary interlude: almost all Algebra 1 curricula put Topic 2 in the back-to-school unit, which is generally presented more broadly to include other functions such as absolute values or square roots and cube roots. What’s unique above is that I haven’t included those other functions (yet) and instead included Topic 1 to draw out our sticky thread, in part for comprehension of Topic 2 and in part because then everything connects so well to…
Topic 3: Adding polynomials. Even students who’ve learned how to add polynomials often struggle to remember whether x2+x2 equals 2x2 or 2x4 . Adding polynomials is normally taught at the end of the year (see the Henrico curriculum), but we have a golden opportunity for connecting to Topics 1 & 2. Our sticky thread says that in the expression 2x2 , squaring the x comes first and the 2 just doubles that result. So 2x2 literally means x2+x2. Here’s how we use Desmos to show it visually:
First, we combine like terms with the numerical expression 42+4+4+42 (see video below):
Next, we generalize to expressions involving x. Check out the visualization of x being a value that changes!
I like UW-Madison professor Martha Alibali’s explanation of the power of algebra tiles: “Algebra tiles can highlight mathematical relationships that are often difficult to ‘see’ in symbolic representations…[P]hysical representations can make aspects of mathematical situations salient in ways that foster sense making and support learning.”
Topic 4: The distributive property and combining like terms.
This includes subtracting polynomials, plus all other combining like terms and distributive property problem types. Subtracting is treated as distributing a -1 and then adding.
I like to include combining like terms questions that incorporate the order of operations, like 3 + 2•5x + 8 (remember to multiply before adding). Students need to see combining like terms as just an aspect of the order of operations.
Extension for advanced students:Advanced students who have mastered this can begin working on exponent rules drills, which were teased in Topic 1. Students who do this must be able to add polynomials perfectly, so they know beyond a shadow of a doubt that x2+x2=2x2 . If they’re 100% solid on this, they may begin working on facts like x2•x2=x4 . Other students will learn exponent rules later in the year, but students who start learning them now will advance to more difficult problems.
Topic 5: Multiplying binomials. This is also usually taught at the end of the year, but since we’ve been discussing how to visualize x•x asx2 , it’s natural to visualize expressions like x(x+1) , too. The segue to multiplying binomials feels smooth and connected to students.
Here’s a quick preview of the lesson:
Extension: To really unify what’s been taught so far, you can ask students to represent the product 3(x+1)2 either with algebra tiles or as an expression. The 3 just tells you how many copies of (x+1)(x+1) to make. The sticky thread again!
Topic 6: Evaluating Absolute Value and Radical Expressions. This covers the topics we skipped back in Topic 2. They take us away from the sticky thread and turn our attention toward the rest of the order of operations.
Topic 7: Building expressions with the order of operations
In this necessary twist on the typical order of operations unit, students learn to read algebraic expressions not left-to-right, but starting from the position of the x. For example, given the expression 4+3x2 , students should say it starts with the x (not the 4), then squares it, then multiplies by 3, and finally adds 4. Even students who can correctly compute 4+3(5)2 numerically will often misinterpret 4+3x2 when it’s presented algebraically, so this takes practice.
Topic 7 is a critical prerequisite to teaching students to solve equations by “unwinding” them, because unwinding expressions means applying the inverse operations in the reverse order. First they must learn to read expressions in forward order.
Here are sample questions for this topic:
Please notice the last question in the pic above, #4. Literal expressions! While most curricula introduce literal equations only to solve them, here we spend several weeks just building literal expressions in the forward order. Only when you can build them are you ready to unwind them to isolate a specific variable.
Extensions for advanced students.To model a real-life situation with an algebraic expression, you’ve got to know the order of computational steps required by the situation. So this is the point where you could include modeling questions like the story problem discussed above, with Ed saving $10 per week on top of $40 already saved. Personally, I’d save this particular scenario for the linear functions unit since it has a clear slope and y-intercept. But I’d absolutely give other scenarios to students who are ready for an extension after mastering Topic 7. Here’s a Desmos extension lesson, Mystery Area, that I made for just this. After Mystery Area, I’d let students try Desmos’ Central Park. Mystery Area should be done by most students (anyone who’s not busy remediating other weaknesses during this extension phase of the unit), while Central Park should be attempted only by those who feel they’re ready for a challenge. Here’s a third extension that lets students think about how to interpret something like 3(x+1)2. I’m still editing this lesson, but you’re welcome to check it out. It’s for advanced students only, I think, and I think it needs some revision.
Topic 8: Solving equations by balancing. This topic is intentionally placed out of order to pause the conceptual progression. We have just finished a topic on building expressions. In the following topic, we’ll learn to unwind them. Since unwinding expressions requires reversing the order used to build them, we need to give students a little extra time to hone their building skills. Inserting solving-by-balancing at this point provides the necessary delay to allow that skill to mature. The balancing steps we follow here will be modeled with algebra tiles, so the topic will feel natural with the flow of the unit.
Lots of teachers hate using algebra tiles for solving equations, and I get why. Kids play with them (which is why all the lessons up till now have used Desmos virtual tiles). And the first couple times kids use them, tiles can feel more confusing than written algebra because you have to count out all these little pieces and move them around. That’s why I never let kids touch the tiles till we’ve practiced the moves by drawing pictures. Animated powerpoints are invaluable here because I can click through the steps while I walk around and help kids follow along. Here’s a short sample of my intro powerpoint:
The reason to use algebra tiles is to help students understand the role of the = sign in equations. Say a kid’s trying to solve 1+4x+3=8. Here are a few mistakes all involving the = sign:
Combining 1, 3, and 8 across the = sign.
Subtracting 1 from the left side twice (below the 1 and the 3)
Subtracting 8 from both sides (below the 3 and the 8) and, instead of writing 0 on the right side, just moving the = sign to say 1+4x= -5.
When students make these mistakes, it’s an indication that they don’t understand how the = sign signals balance between the sides of an equation. Which means they may not have fully internalized what equation-solving is actually about. Algebra tiles allow students to develop this understanding progressively by situating the problem within a context of balancing. Within their first lesson using tiles, student go from solving equations without like terms to solving ones like 2x+15=x+3+3x, and the tiles allow them understand what you can and can’t do with each term.
Links: Here are lesson materials for the intro lesson (.pptx, student handout). After the intro lesson, we consolidate what we’ve learned about respecting the role of the equals sign with these materials (.docx and .pdf). Finally, we transition from algebra tiles to symbols (.pptx, student handout, teacher notes).
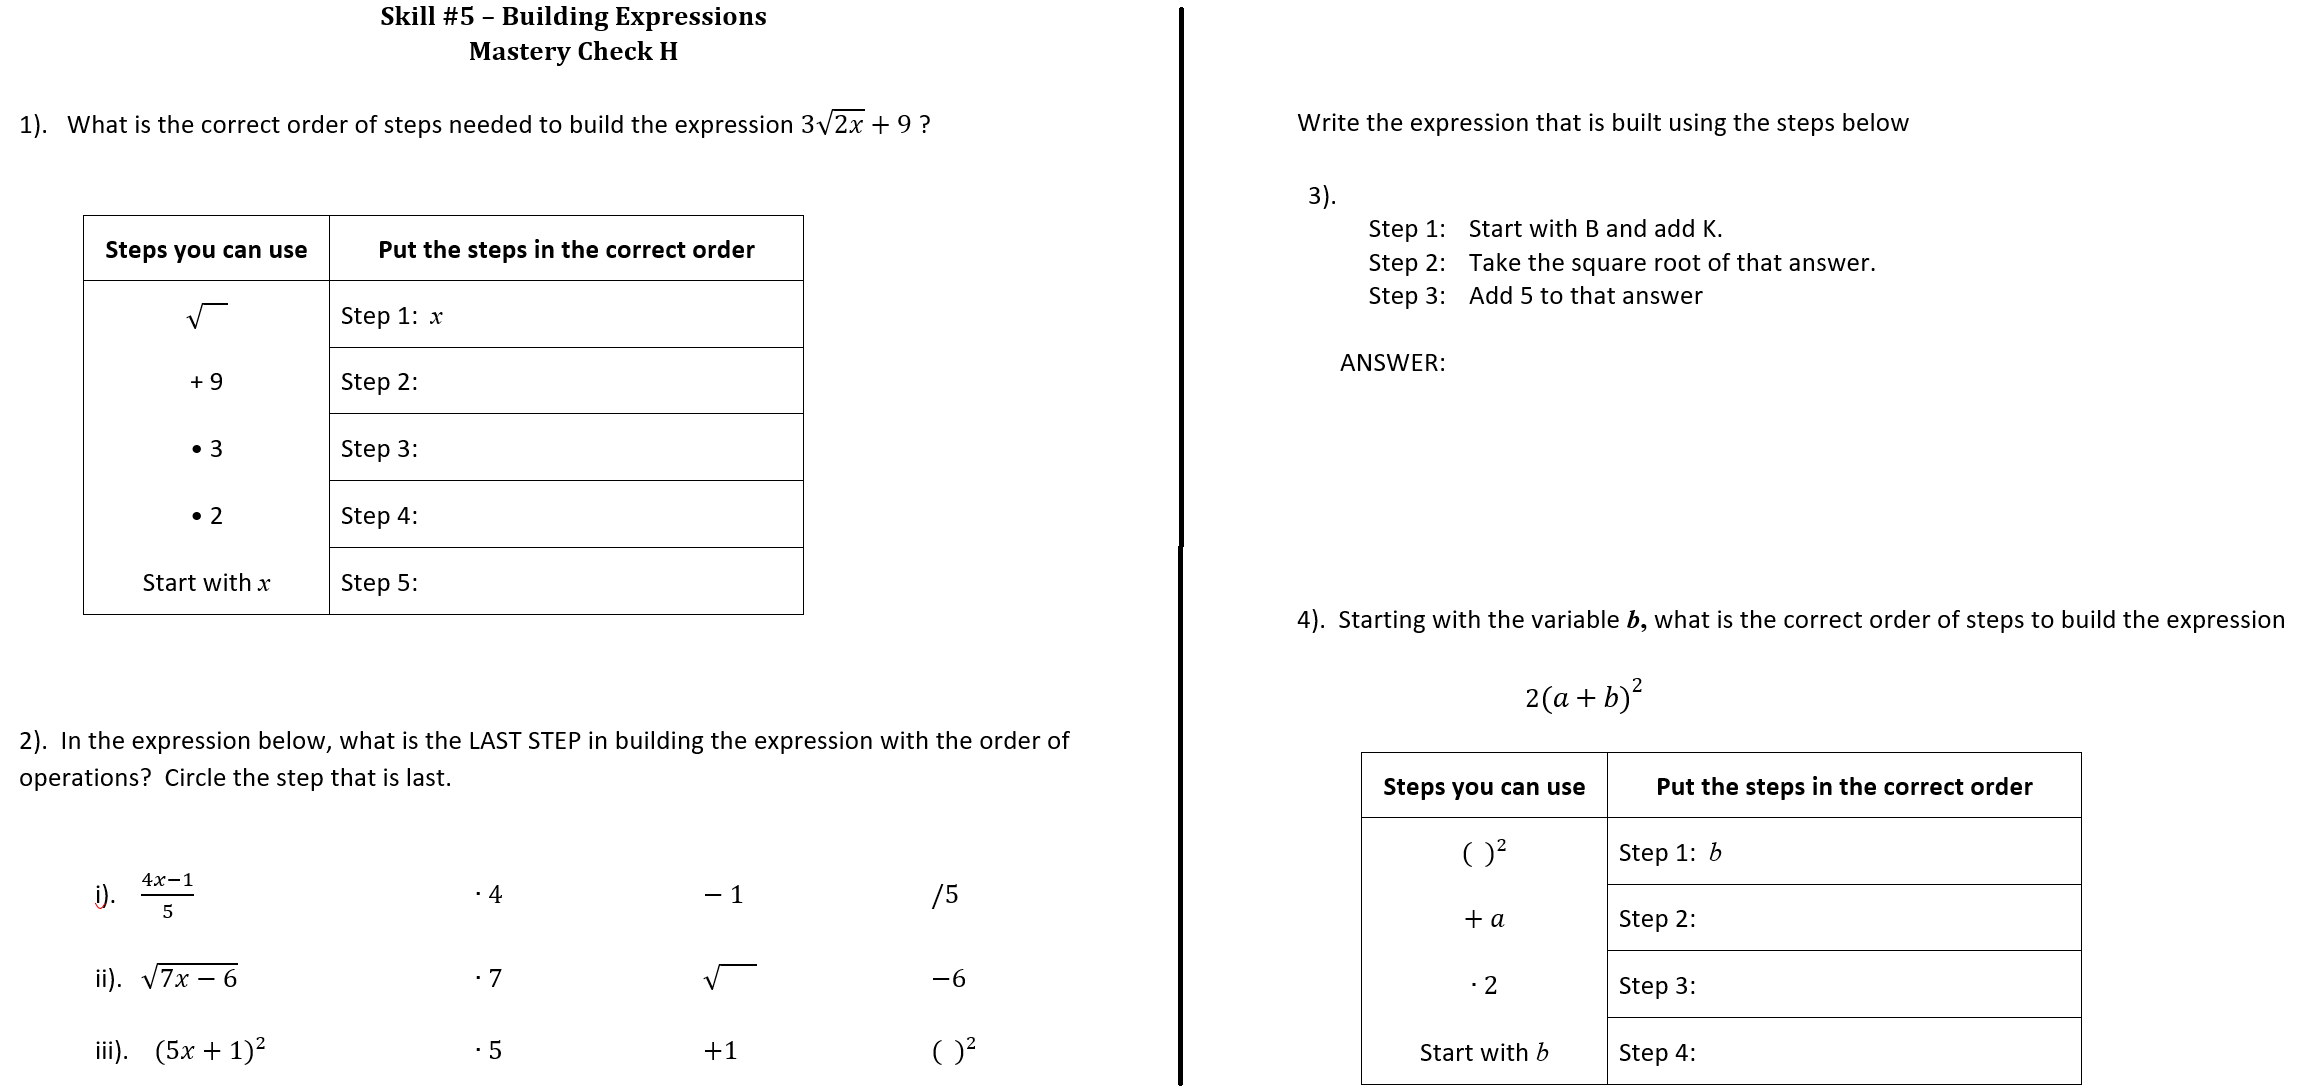
Topic 9: Solving equations by unwinding them. Instead of using a balancing metaphor here, we’ll isolate x with an unwinding metaphor: getting x by itself by using the inverse operations in the reverse order. This allows us to tackle nonlinear equations, including quadratics that can be solved by taking square roots, but also including all sorts of other forms: equations with nested fractions (see the picture below), or radical signs, or even quadratics/radicals within nested fractions.
Intro: you have to unwind in the reverse order. I have a fun intro lesson to Topic 9 based around number tricks that ask you to pick any number, follow a bunch of computational steps, and then give you back your original number (.pptx, handout .docx, teacher .docx, handout pdf, teacher pdf).
Main lesson:Now students learn to solve by unwinding. They’ll solve all different kinds: radical equations, equations with complex fractions, and quadratic equations. This is a flipped lesson — students watch a video I made and fill out the notes. Materials here (handout .docx, handout pdf, lesson video, answer key pdf, answer key .docx). Here’s a sample screenshot of the process students learn to use:
Literal equations: Literal equations flow directly from this. If you want to solve 4(a + m)2=C for the variable a, you just list the steps to build the left-hand side starting from a, and then you do all the inverse operations in the reverse order. It’s the same concept as solving by unwinding. Since most curricula, e.g., Henrico, teach literal equations in the 1st quarter, they also ought to teach other unwinding strategies in 1st quarter…notably, solving quadratics by taking square roots. As I said earlier, I don’t plan to teach using the ± sign to find both roots of a quadratic here. We’ll just practice finding the easier root for now. In 4th quarter, we’ll introduce the ± sign and connect the two roots to the intercepts of a parabola.
Extension for advanced students: Because Topics 1 & 2 focused on the difference between -52 and (-5)2 , advanced students can learn about using the ± sign if they’re ready. This video is my flipped lesson on the topic, so it can be mostly self-guided for advanced students working together. Meanwhile, other students will work with me to remediate their weak spots. When we cover the ± sign in 4th quarter, students who have already done it will do a different enrichment activity.
By the end of the unit, I want students to be like a spider, able to dance across this web without ever getting stuck. Able to repair any connection that breaks by spinning new thread. And able to sit in the center calmly regarding the whole through a multitude of eyes.
Classical music connection
Have you ever listened to Antonín Dvořák’s 9th symphony? Each melody is striking as you hear it. But Dvořák then weaves these themes into a coherent whole with such depth that it’s virtually impossible to perceive all the connections at same time, giving us this sense of something complete, something absolute, which we can comprehend beautifully from any angle, but the whole of which we can never see.
You can get a taste, and some explanation of the interwoven themes, below. I wish math class felt like this:
Connections to other teachers’ ideas
Jonathan Claydon is also busy reordering topics to show math’s internal connectedness. Here’s his summary of the talk he gave at NCTM ’18 on his work.
In contrast, folks at Illustrative Mathematics (hi, Tina!) frequently press the point that busy teachers can almost never knit a curriculum together successfully — that teachers really should focus on implementation and adaptation. Here’s a blog post in which Brooke Powers gave her experience of letting go of the curriculum reins and following the IM curriculum.
Rose Roberts wrote recently about how she’d like to group Algebra 1 topics into themes.
You may have heard about the awesome work Jonathan Claydon (@rawrdimus) has done to reorganize topics in Algebra 2 to create a more coherent flow. When I found out about his project, I was ecstatic because my project for the last 14 years has been to do the same to Algebra 1 in a way that makes it more accessible to students with weak preparation, while simultaneously making it more meaningful (and in that sense, more “rigorous”). If you’ve followed my blog for the last 2 years, you’ve seen that I’ve begun to open up about my aspirations and my unit outlines.
Today I’m posting a tidbit of my curriculum outline here for feedback and for your reflection. If you skim it too quickly, it may look like any other curriculum. If you look at it more closely, I think you’ll see some differences between this and most other curricula (I’m curious if I’m wrong about that — please let me know).
By the way, Algebra 1 in Virginia is similar to Math 8 in CCSS states, but with quadratics thrown in at the end.
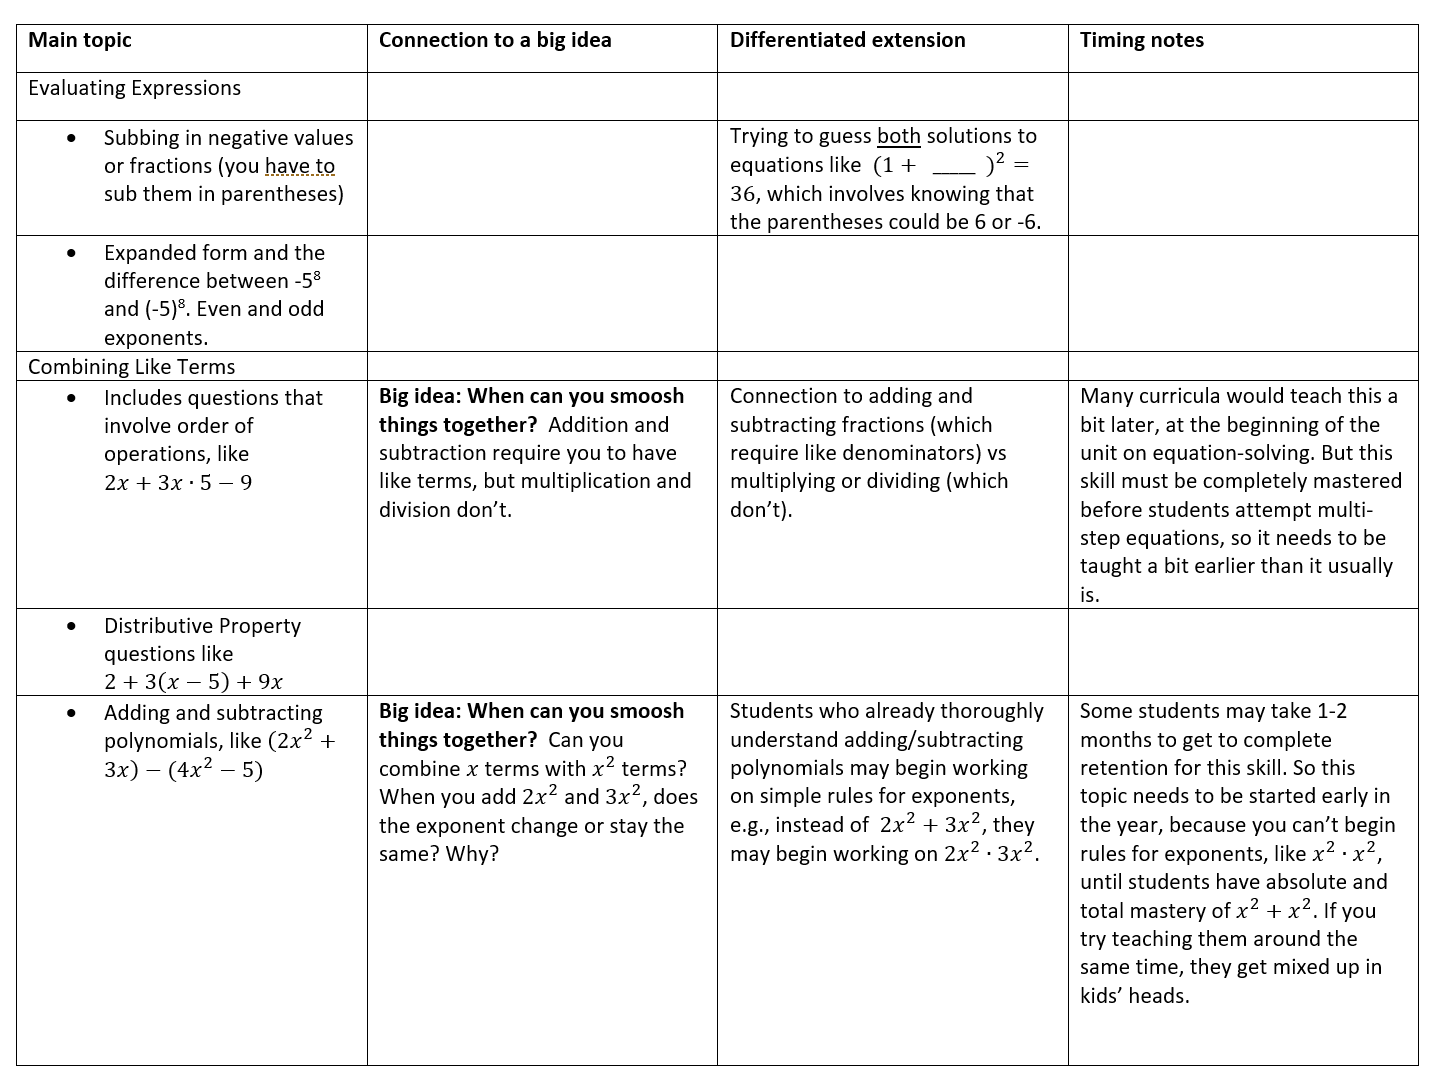
One feature of my curriculum is that topics include differentiated extensions. These aren’t just harder versions of the same problems the class is already studying. They’re also not the same as the Depth of Knowledge questions that Robert Kaplinsky likes so much. Instead, they’re designed to expose hidden connections between several topics. Students who do the extensions won’t just be more computationally proficient, and they won’t just understand this topic better — they’ll also see math as more of a coherent whole.
Here are the first 2 units. The column called “Connection to a big idea” lists connections that I think Algebra 1 students typically miss. I intend these big ideas to be themes that run throughout the whole year, similar to Jonathan’s theme of “how is the graph of an equation related to the solutions of the equation?” Of course, there are many more big ideas in Algebra, but these represent the hidden themes that I’ll work to surface wherever possible.
I don’t know any other teachers who do polynomial addition/subtraction in their beginning-of-year unit on combining like terms, but I think the reasoning at the bottom of the “timing” column is solid.
The differentiated extensions represent the 30% of the curriculum that I want all students exposed to, but don’t think everyone needs to practice extensively. They’re part of Algebra 1, so everyone will see them at least a bit. Students who are up-to-date on their power standards will get them in depth: they may watch a flipped-class video or get some small-group time with me, and then they’ll do independent practice. Meanwhile, students who are still working on the power standards will participate in some whole-class discussion and a few whiteboard practice problems if appropriate, but won’t study them in depth until they meet the power standard goals. (Those goals are assessed as part of my quiz generator project). What’s a power standard and what’s differentiated extension is determined by my state standards and my sense of what’s critical for Algebra 2, and a big part of this curriculum outline project is to clarify the difference.
(All students will eventually get basic exponents rules, but students who started them early via the extension from Combining Like Terms will get into more difficult exponents problems).
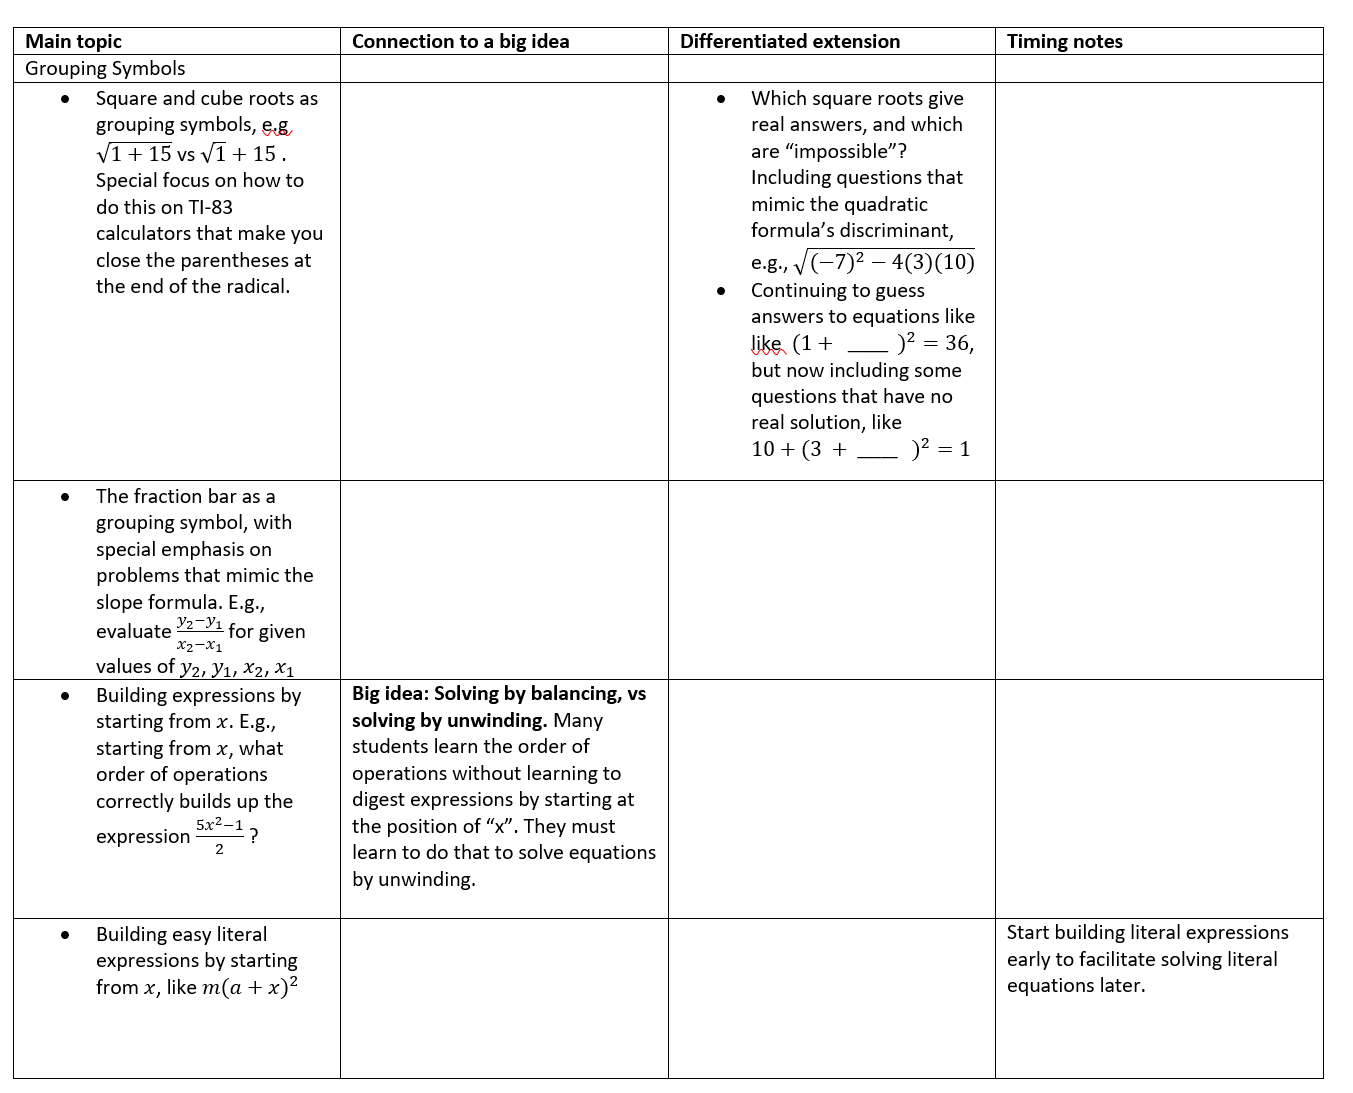
Here is the next unit:
[Update 5/31/18: I’ve been working on more differentiated extensions for the Grouping Symbols unit. Since the key idea is building up expressions, advanced students can work on modeling situations with expressions. That’s tough to teach, because students always have a zillion questions and I can’t spend the whole period with my extension kiddos — I need to have substantial time to sit with students who are struggling and reteach power standards like combining like terms, evaluating expressions, or building expressions. So I created this Desmos activity on modeling with expressions. It has so many Desmos bells and whistles it’s virtually a steam train — I worked hard on the video embedded in it. With all the embedded supports, students should be able to work toward modeling situations with expressions without too much assistance from me. Then they may be ready for Desmos’ Central Park the next class, probably with a bit of help from me. It may seem crazy to you to teach modeling with expressions as an extension rather than a core, whole-class activity, but the reality is that in Virginia, this skill isn’t really in Algebra 1. Instead, Virginia focuses modeling questions on slope-intercept or standard form, or on totally contrived questions like, “Write an expression that represents two more than the product of 5 and the sum of 3 and half a number.” Which is really more of an English grammar question than a math question, to be honest. Ugh. /end]
You may be wondering what “building expressions” looks like on a quiz. Here’s a sample formative assessment:
I don’t know of any other teachers who even ask questions like these, though maybe I’ve just been living under my rock for too long. I’ve found that a few months of sporadic preparation along these lines means all students can solve literal equations, though. Pretty cool.
By the way, the Building Expressions questions above are part of my quiz generator, which I think will be getting some nice upgrades this summer. Someday the entire item bank will be big enough I can share it publicly without worrying about test security.
Writing up these outlines of my units were a good reflection for me, so I’ll keep it up until I have the whole year outlined.
Is this how you already teach? Do you have strong objections or ideas for improvement? Thank you, math teacher community, for helping us all grow.
Update: Rose Roberts writes in on Twitter to mention throwing radical expressions into the mix, too:
I haven't finished the whole post but I've unsuccessfully pushed for polynomial operations (and now radical ones too) to be at the beginning of the year – to start off with all of our equivalence of expressions – EVERY YEAR that I've been here.
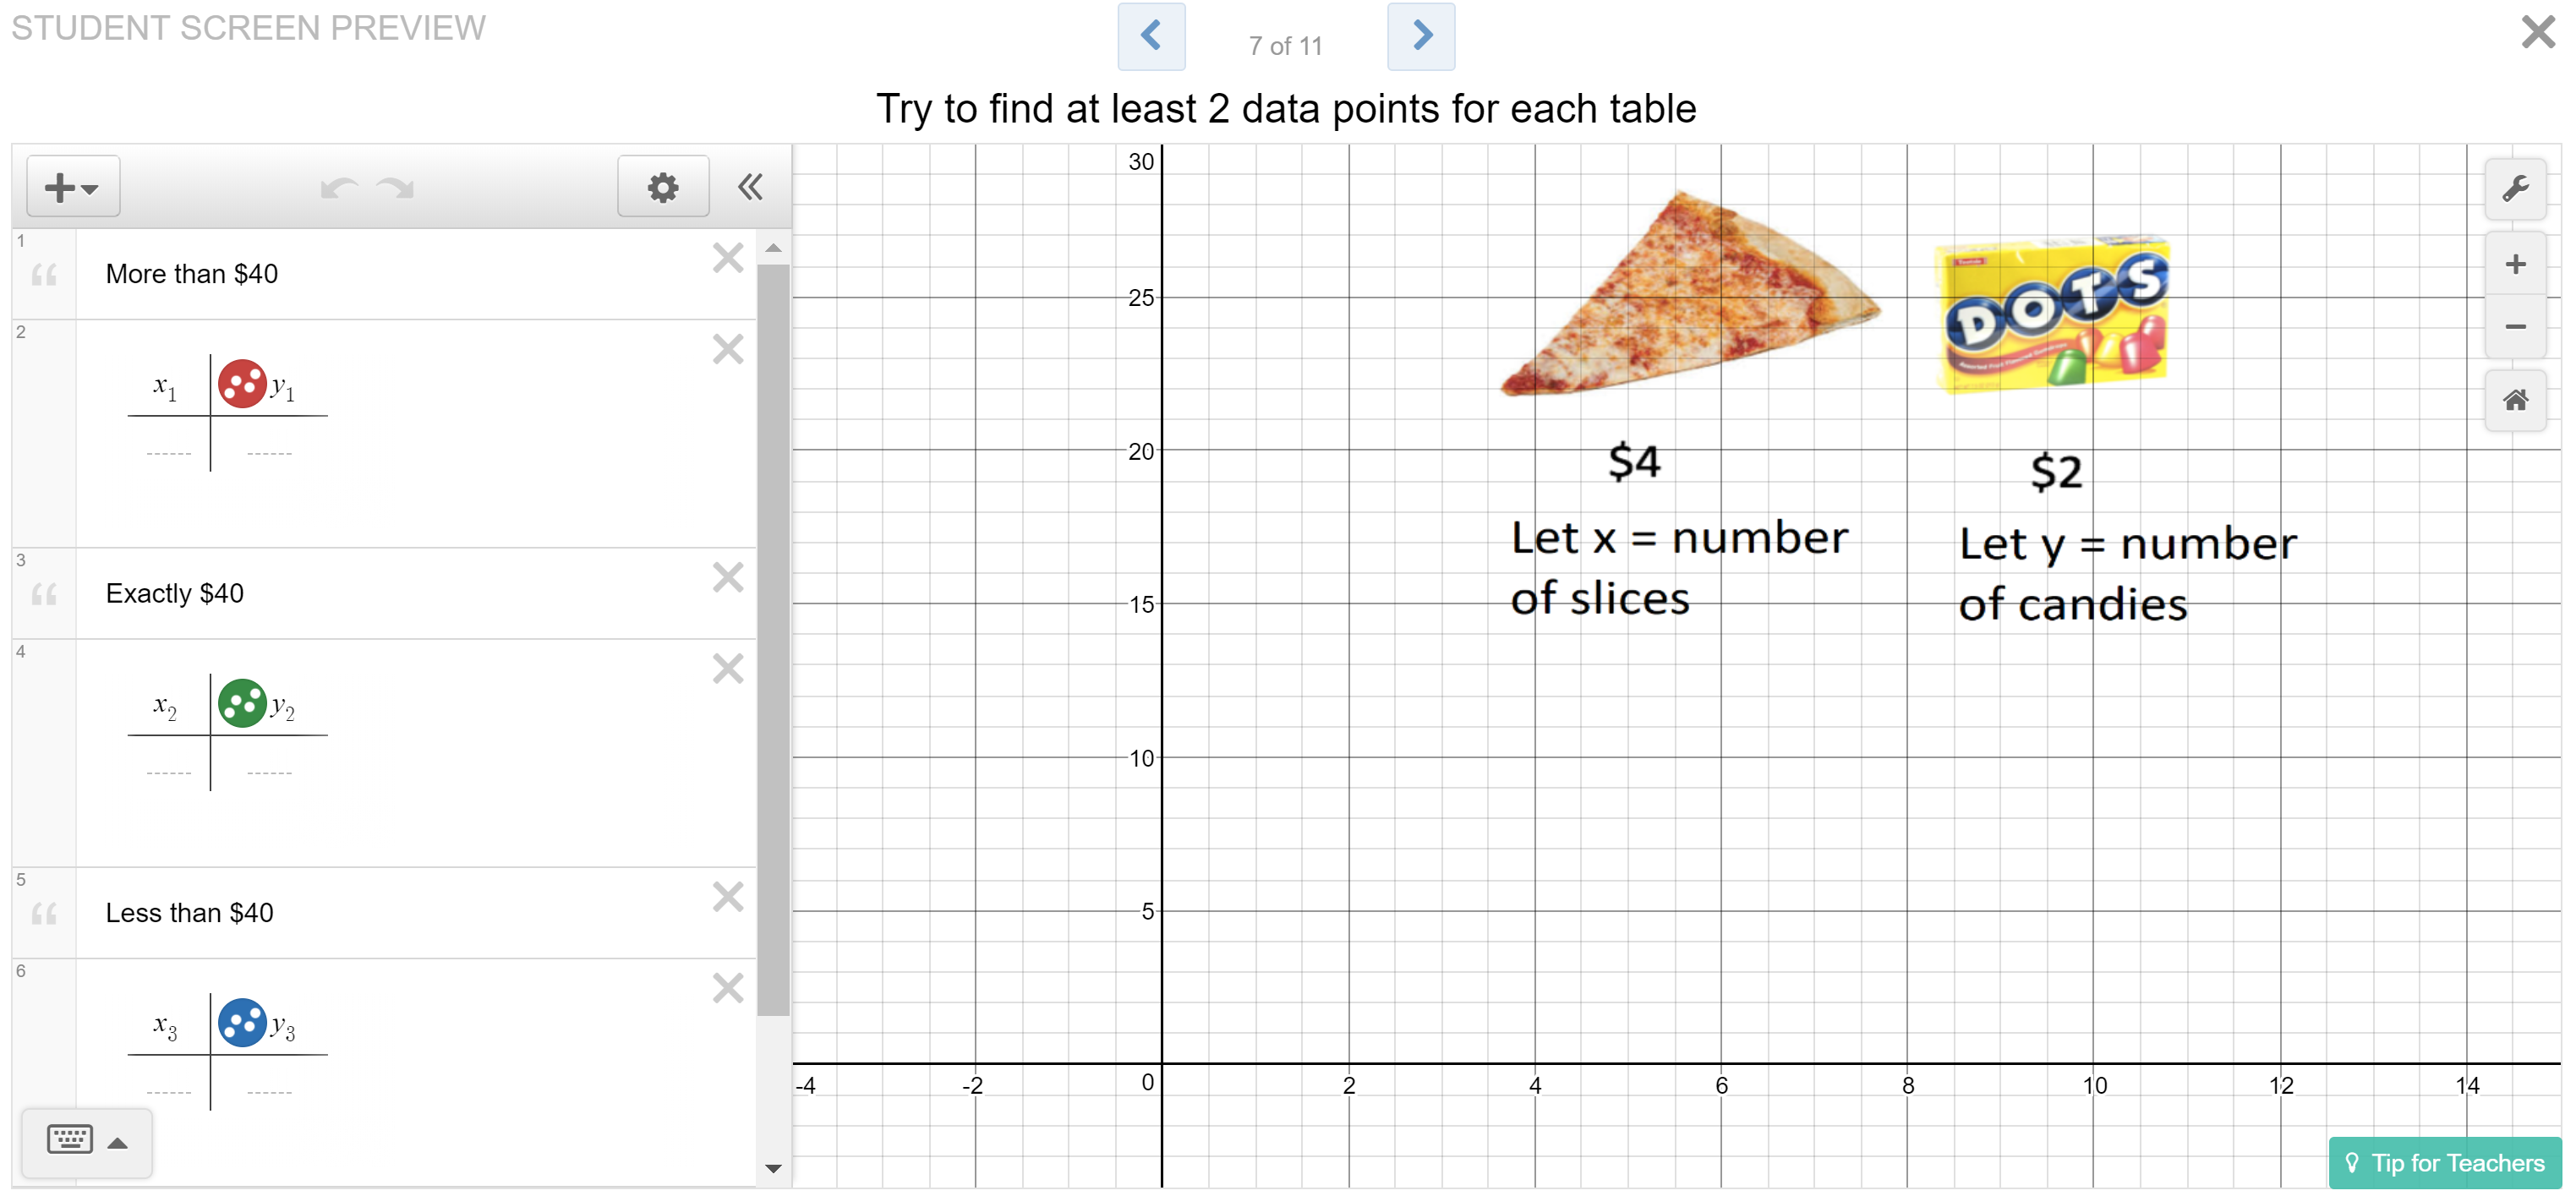
The Desmos overlay function turns out to be a really nice way to introduce 2-variable inequalities. Today we did an activity that centered around the screen shown below. A link to the activity is at the bottom of this post. For the prices shown, each student tried to create some data points that totaled more than $40, some points that totaled exactly $40, and some points that were less than $40.
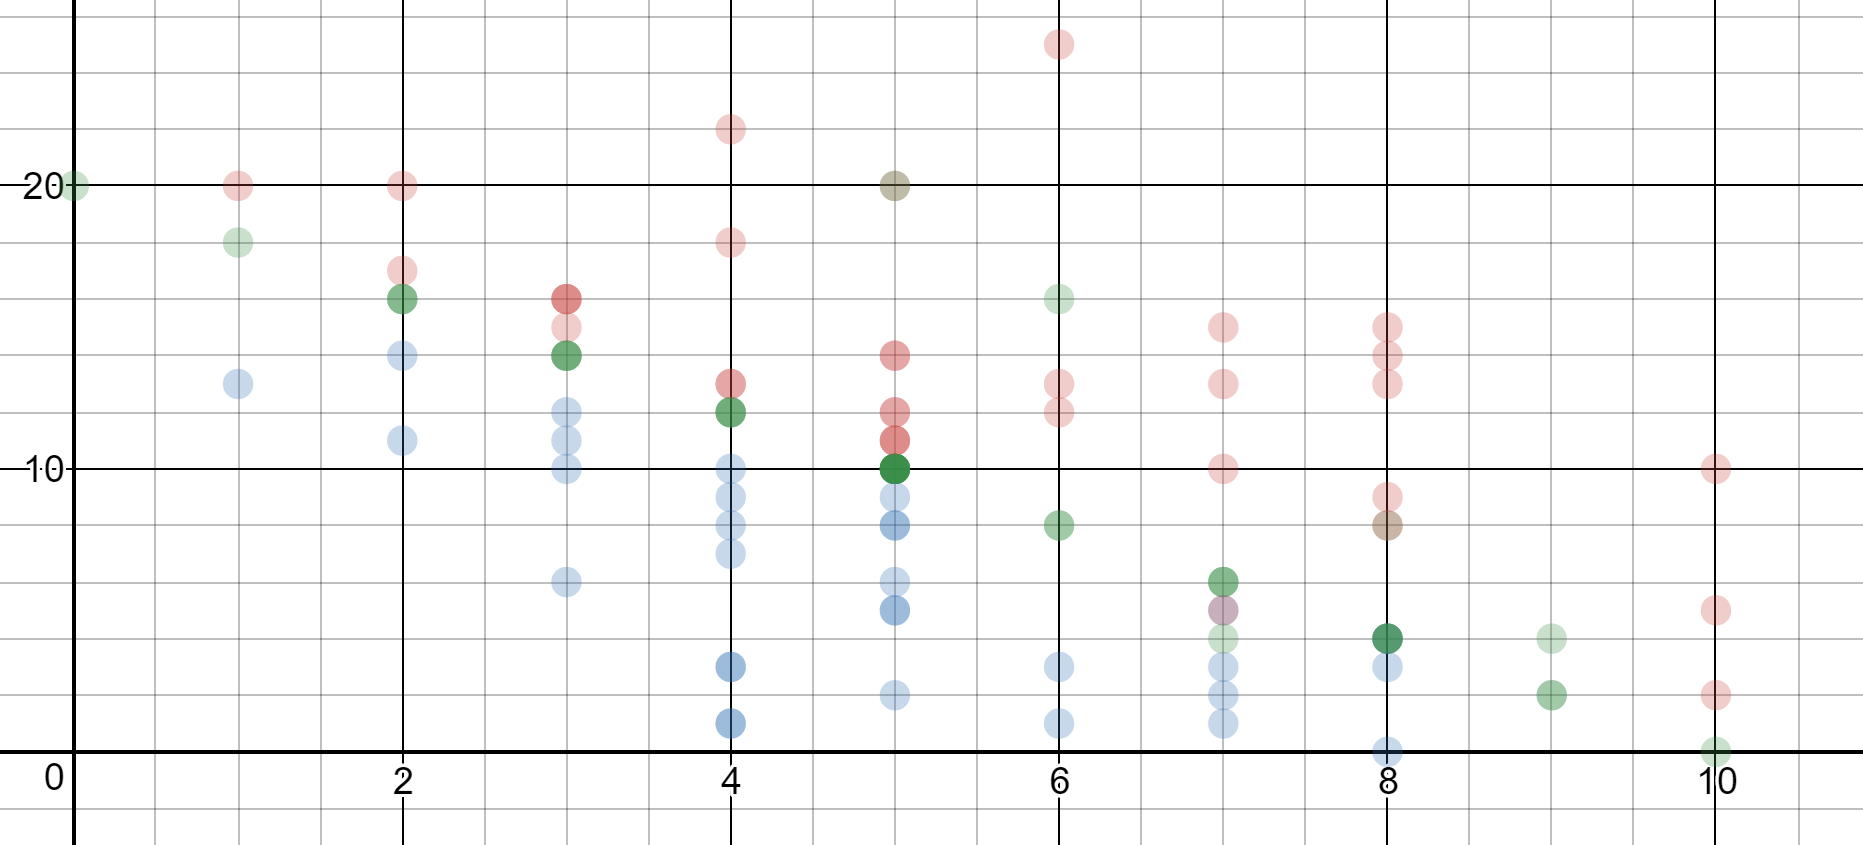
It’s pretty simple work, and it’s low-stress because students can basically try anything. We’re making use of all answers whether they total to more than $40, less than $40, or exactly $40, so they can just play with numbers without worrying that they’re doing it wrong. When you overlay their graphs, you get something like this:
This is a really nice intro to linear inequalities. The green points should all lie on a line, the blue points below the line, and the red points above. Someone else in the MTBoS blogged about a similar lesson several years ago. I don’t remember who it was, but if anyone knows, I’d be happy to credit her. (I think it was an 8th-grade teacher in Massachusetts).
Nitty-gritty teaching moves
Here are discussion notes to wring the most out of the screen shown above. Students may become confused if they (correctly) find some green points that are actually higher than some of the red points, or blue points that are the same height as red points. I reassure them that if they know their calculations are correct, the whole-class discussion will solve the mystery of the graph. Once enough data has been gathered, I show a few students’ responses, and highlight what students found interesting or confusing. For example, “Is it weird to you that the point (2, 10) is blue, but the point (8, 10) is red, and yet they’re at the same height?”
If students don’t express puzzlement, then I just ask if students see patterns for why the different colored dots ended up where they did. Prompts to use:
Do you see any green points in the wrong place? How do you know?
If you have a SMARTboard, you can circle where the green points should be, to highlight that they’re on a line. Draw the line in green marker. Cross out any green points that are in the wrong place for the sake of clarity.
Why is the slope negative?
Students will have a legit hard time with this. That’s because they’re still thinking in the logic of Slope-Intercept Form, not of Standard Form. That is, as you move to the right on the graph, you’re increasing the number of pizza slices. If y represented the total cost, it would increase as you move right. But here, y represents the corresponding number of candies you can buy to get the same $40 total cost. Buying more pizza means you can afford fewer candies. It’s important not to skip this discussion, because it’s the key conceptual transition from Slope-Intercept Form (where y is the output) to Standard Form (where y is another input that adjusts to keep the total amount constant, and is only an output implicitly).
Do you see any red or blue points that ended up in the wrong place? How do you know?
If any of red/blue points did end up in the wrong place, asking this question is a great opportunity to draw out the pattern. A student can circle a wrong point and say, “That point is incorrect because all the blue points are supposed to be below the green line, and the red points are supposed to be above.”
At the end of the discussion, I guide the class into translating their work into a Standard Form equation. To do this, I choose some green points and show how to prove on one line of the calculator that they make $40. For example, (5, 10) works because 4(5)+2(10)=40. And (20,0) works because 4(20)+2(0)=40. The equation for this pattern is 4x+2y=40.
Here I throw in the vocabulary of “Standard Form”.
Finally, I ask students to type the equation 4x+2y=40 into their expression list. Some will be impressed when they notice that the graphed line goes through all their green points.
The real kicker is when you ask them change the = to a >, and the graph shades above the line. For some reason, that gets audible gasps, and a few comments like, “Okay, that’s actually kind of cool.”
*Admission of guilt: yes, most of this blog post is cribbed from the teacher notes I wrote for this screen of the Desmos activity. Hey, recycling, right?
Am I crazy, or do we lump Algebra topics together all wrong?
The longer I teach, the more confused I am by the topics we choose to lump together into units. This lesson is a great example. Learning to think in Standard Form, when you’ve only ever thought in Slope-Intercept Form, is a legit conceptual shift, as I described above. It’s essentially the shift from thinking of a function defined explicitly to one defined implicitly. It’s conceptually huge! And yet we lump those topics together because they both graph as lines. From our expert perspective, they belong in the same topic. But it will take novices a week to start seeing them as they same topic!
Granted, I do teach Standard Form equations a bit in my Slope-Intercept unit, but all we do is transform them into Slope-Intercept and then graph them. They’re just puzzles… hmm, someone wrote this equation in a weird form, and we have to fix it. That’s all. We don’t discuss the logic of Standard Form at that time, because it’s almost the polar opposite of the logic we’re studying, and student brains so often mush opposite ideas together in a confusing muddle.
Instead, and as far as I know I’m the only person who does this, I teach Standard Form as my intro to 2-Variable Inequalities. Because before students really see that y (the number of candies) is really determined by x (the number of pizza slices) in a clear way that can be expressed in an explicit form, their natural thinking really is guess-and-check. Some guesses are too high, some are too low. Their natural thinking is really in terms of inequalities. So now, we’ll study graphing inequalities, both in Standard Form and in Slope-Intercept Form. This will include drill practice and application scenarios.
After that, and only after that, will we start graphing Standard Form by finding the x-intercept and y-intercept. The goal is for students to see the line generated by Standard Form as a solution set — a bunch of points, all of which satisfy Ax+By=C. If I introduce Standard Form and show graphing-by-intercepts too early, students will see the line as a shape, not a solution set. They’ll see it as the line that connects the intercepts, but they won’t see that the points between and beyond the intercepts are also solutions.
Someday, I’ll write a post explaining/ranting at other topics that I think are paired weirdly in Algebra 1. Here’s a taste of that…I’m throwing it out there in the hopes that someone in the comments or on Twitter will either agree with me or convince me that I’m wrong: Isn’t solving quadratics by taking square roots much more closely connected to the order of operations than to solving by factoring? Because the work involved is basically unwinding the equation by reversing GEMDAS. Shouldn’t it be taught early in the year, when you’ve just finished order of operations and grouping symbols, and you’re moving into solving equations?
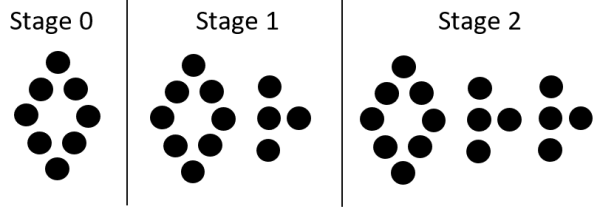
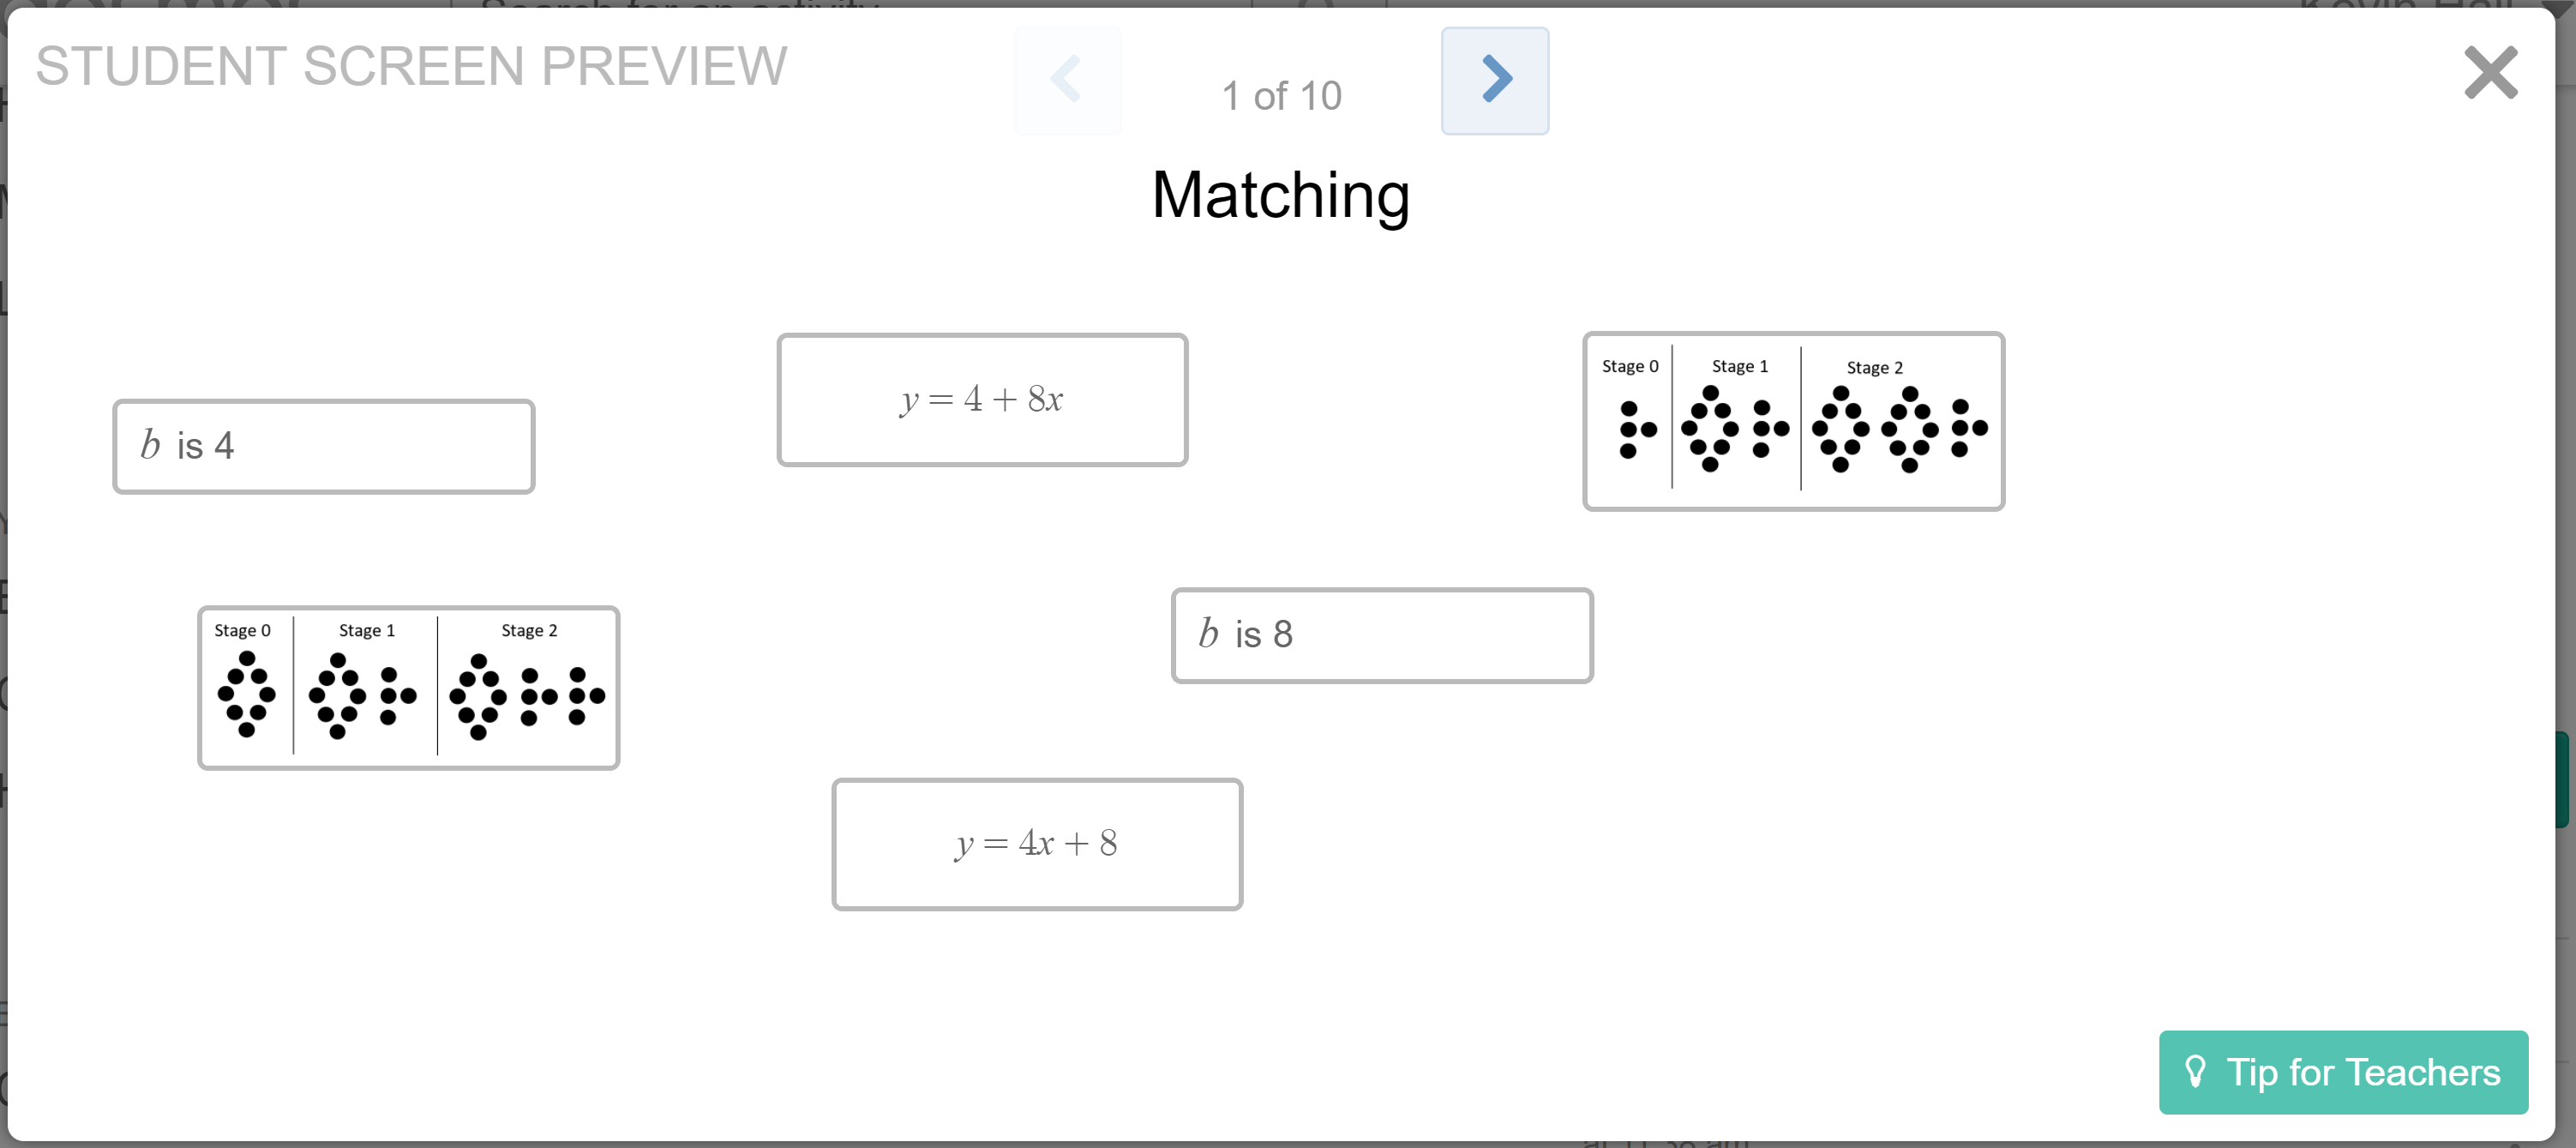
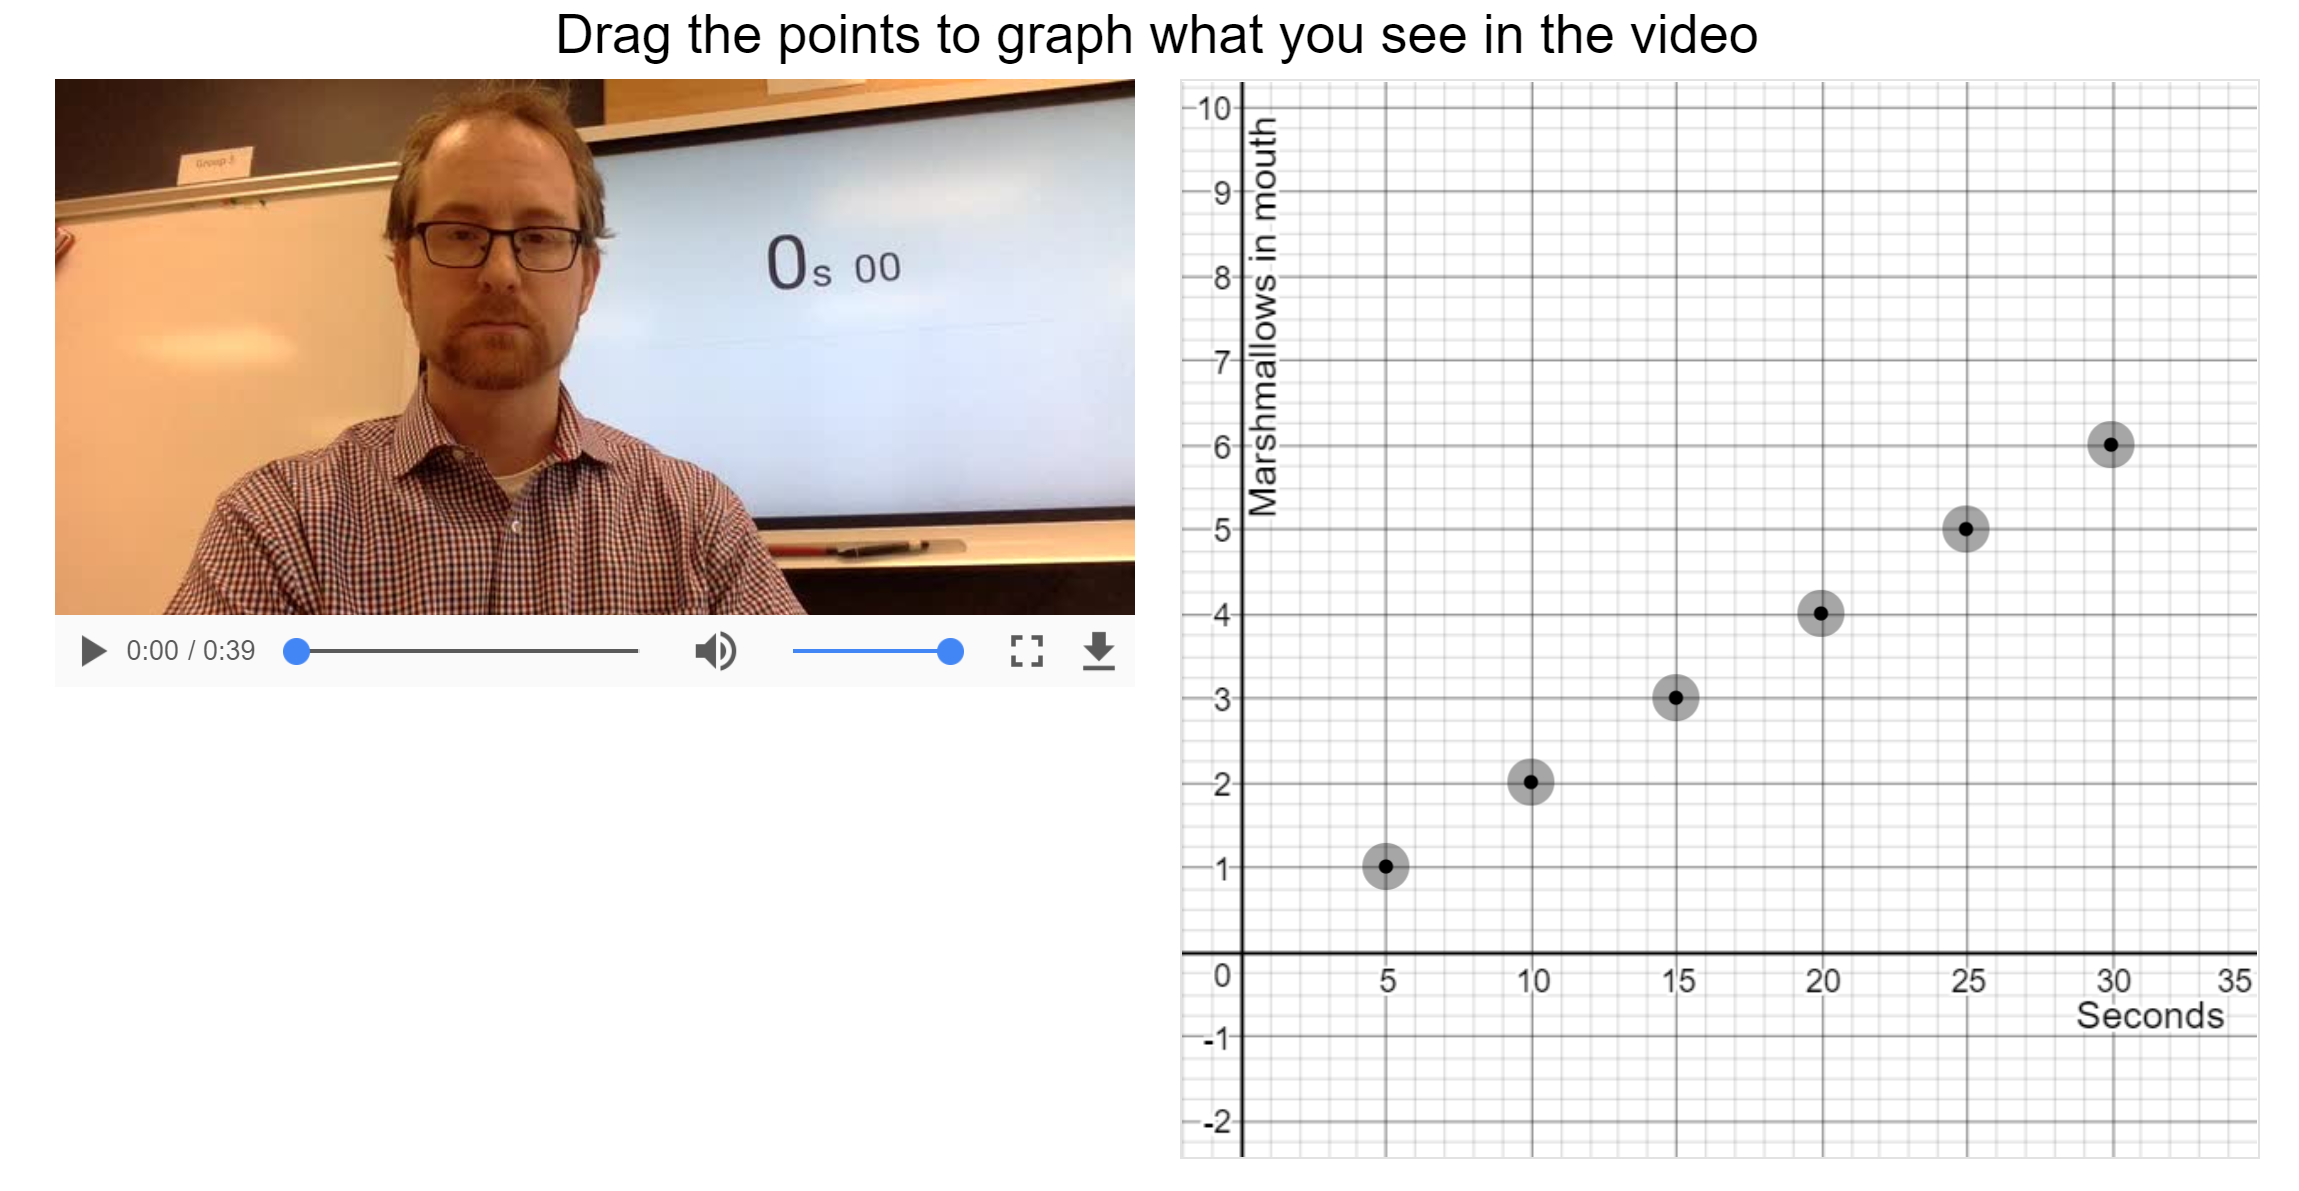
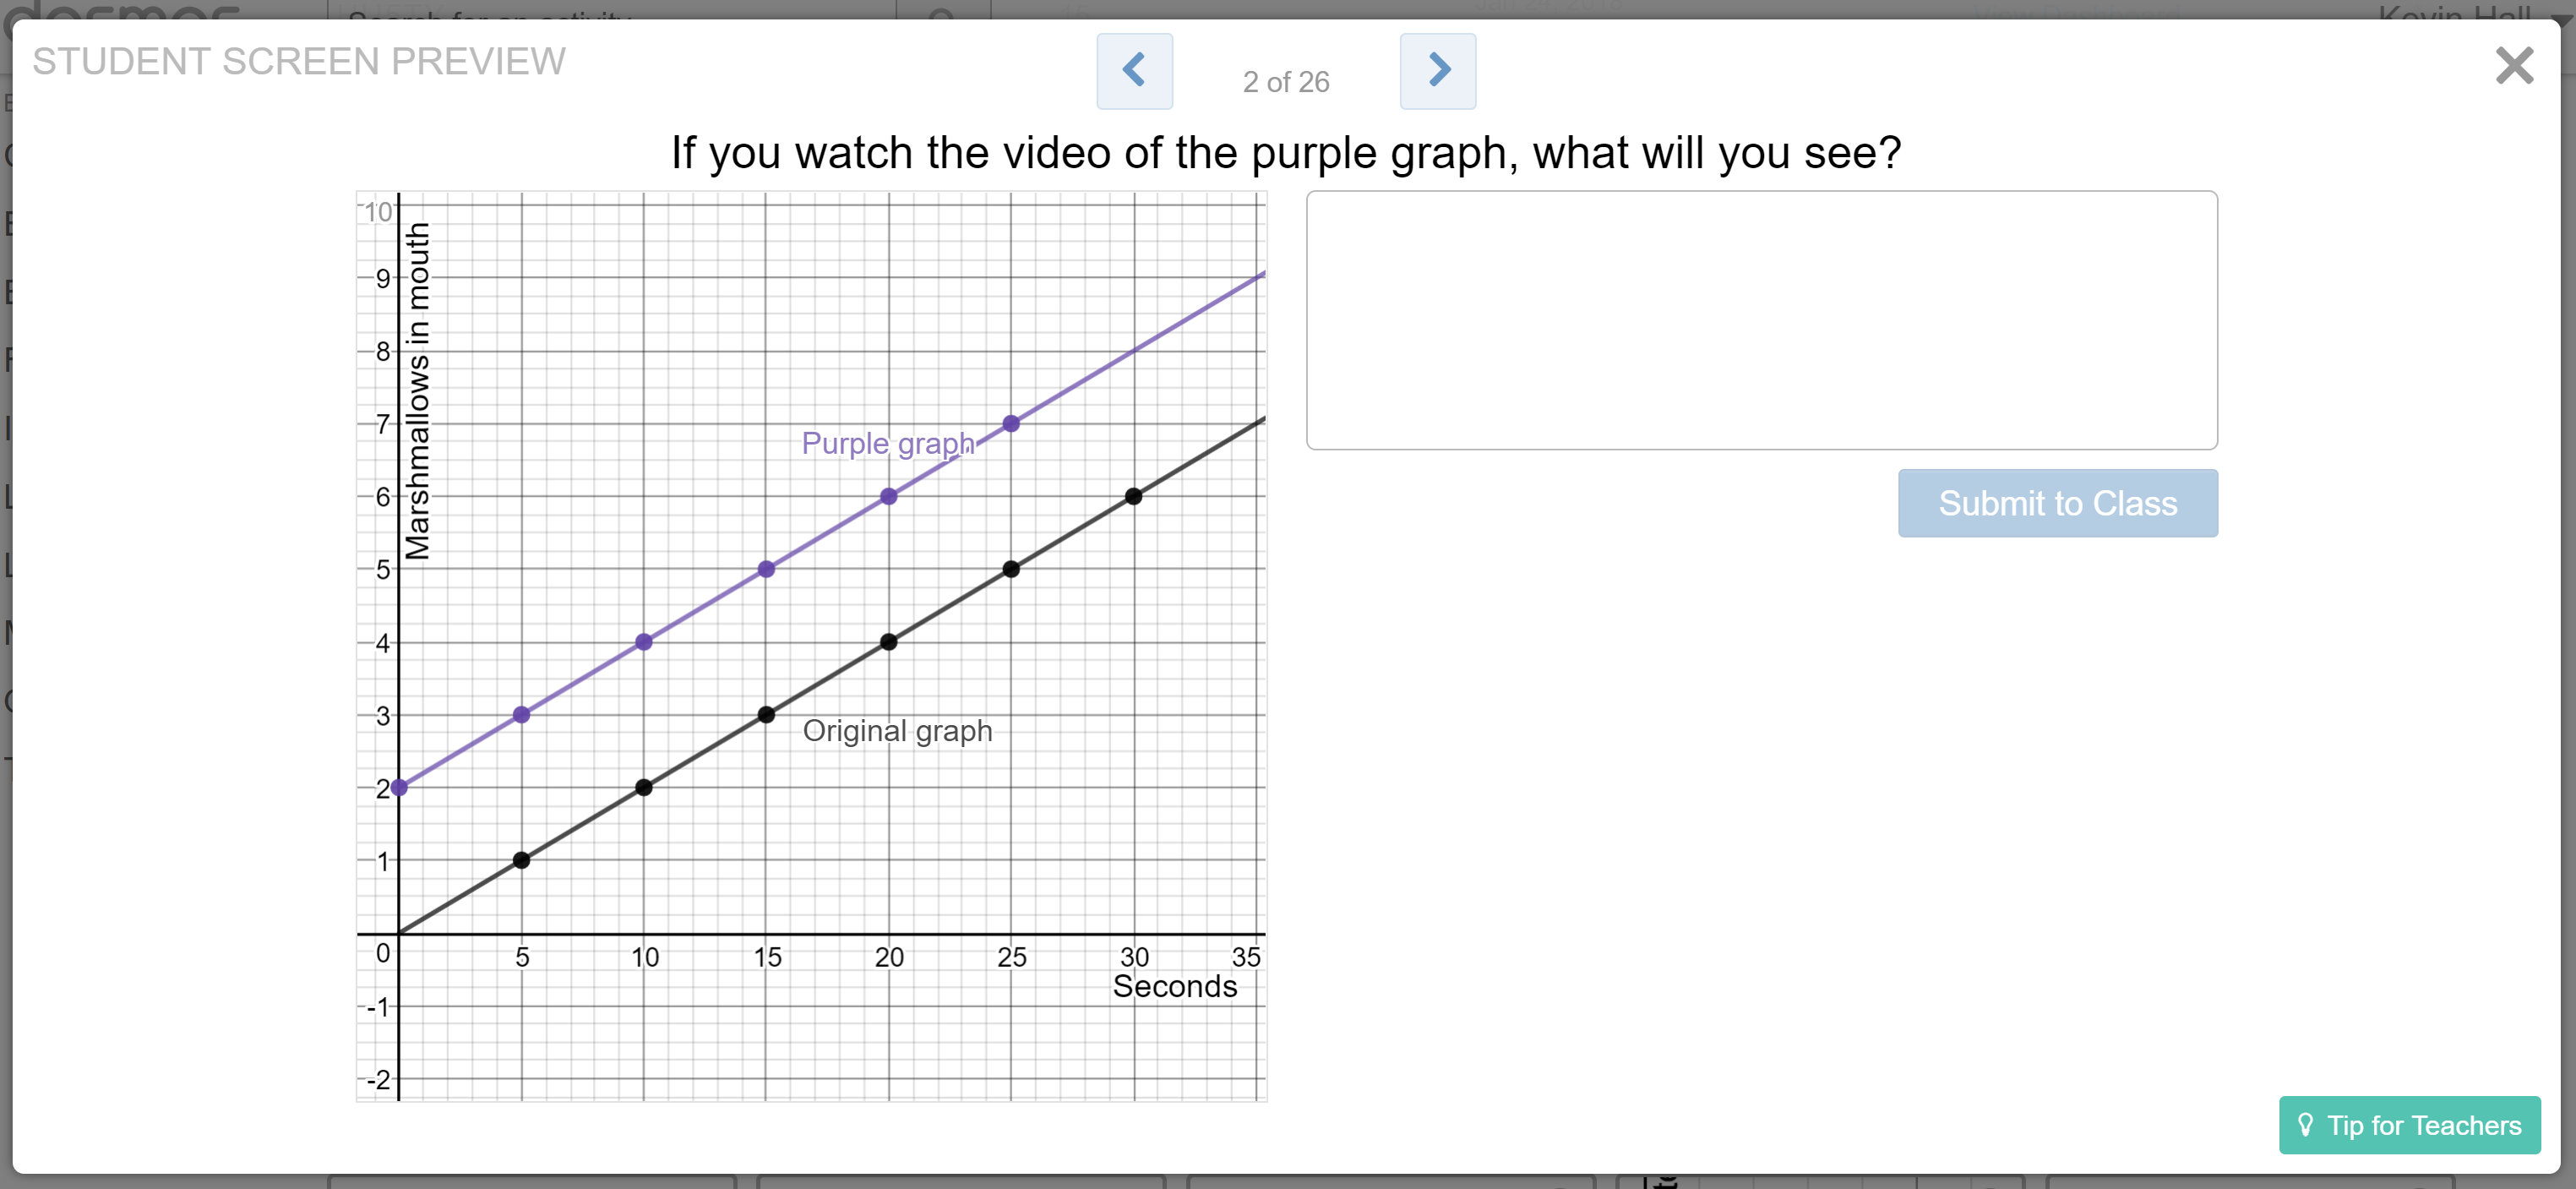
It’s time to learn how to see m and b on a graph. To dip our toes into the topic, we had a nice debate in class about the rate shown in this quick video.
Is the rate 1, or 5? They couldn’t decide, because the number of marshmallows is increasing by 1, but the time keeps increasing by 5. It’s such an incredibly simple question, but their inability to decide hooked them for an entire lesson about graphing slope and y-intercept.Part of the hook was, I think, that many knew in their guts that both answers were incomplete.
I’d bet these students would have gotten the correct rate back in 7th grade. But as you know, students sometimes over-apply recent learning in a way that erodes old knowledge. So we’re here in Algebra 1, having done an entire sequence on identifying m and b, and that has skewed their thinking. We’ve looked at visual patterns, like this one with m=4 and b=8:
And we’ve looked at story problems, like this:
So far, m has always been an integer. That makes the marshmallow rate of 1/5 difficult: this lesson is the moment when we transition to m as a rate or ratio.
In this blog post, I’d like to share a Desmos lesson I made to capitalize on this moment of confusion. It turned out to be pretty engaging. You could use the lesson as-is or edit it to insert videos of yourself stuffing your face or doing something similarly silly. Here are the phases of the lesson:
1. activate knowledge of m and b
First I shared the purpose of the lesson: how do you see m and b in a graph?We began by listing what we know about m and b on the board:
b:
Beginning amount
stage 0 of a visual pattern
constant amount
By itself in the equation y=mx+b
m:
amount a situation grows by
Multiplies in the equation y=mx+b
(I’m normally a nix-the-tricks kind of guy, but m and b are arbitrary choices of letters for slope and y-intercept, so I’m okay with mnemonics here.)
2. practice m and b
Students paired up, sharing a computer, and worked at their own pace through a bunch of card-sorts identifying m and b in this Desmos activity.
The focus is on identifying b at first. I’ve learned that when I ask students to focus on m and b simultaneously, the weakest students always mix them up and never learn the difference. If I ask only for b, they can actually learn both m and b better.Students absolutely must know the difference between m and b in story problems and visual patterns, or else they’ll never be able to comprehend representing those quantities in a graph. So keep in mind, this activity comes after 3-4 days of practicing m and b a little each day.
I displayed the “summary” Desmos report on the screen while student pairs did the card sorts, so they could see if they were getting correct answers by looking for the check-mark on the teacher dashboard. At this point, the Desmos pacing was set up to stop them at the end of the card-sorts.
3. puzzle over the marshmallow video
Continuing the Desmos activity, we watched the marshmallow video as a whole class (nice laughs there) and graphed the situation, as you can see here:
(The points can only be dragged vertically, because I didn’t want to deal with arguments about whether the marshmallow went in at 5 sec or 5.5 sec.)
The following screen asks students to identify m and b in the marshmallow-eating video. This is where we had our big debate: does m equal 1 or 5? The disagreement here drove the momentum forward — we agreed to start learning to see b on a graph, and to keep puzzling over the mystery of m. That was the end of the warmup/hook phase of the lesson.
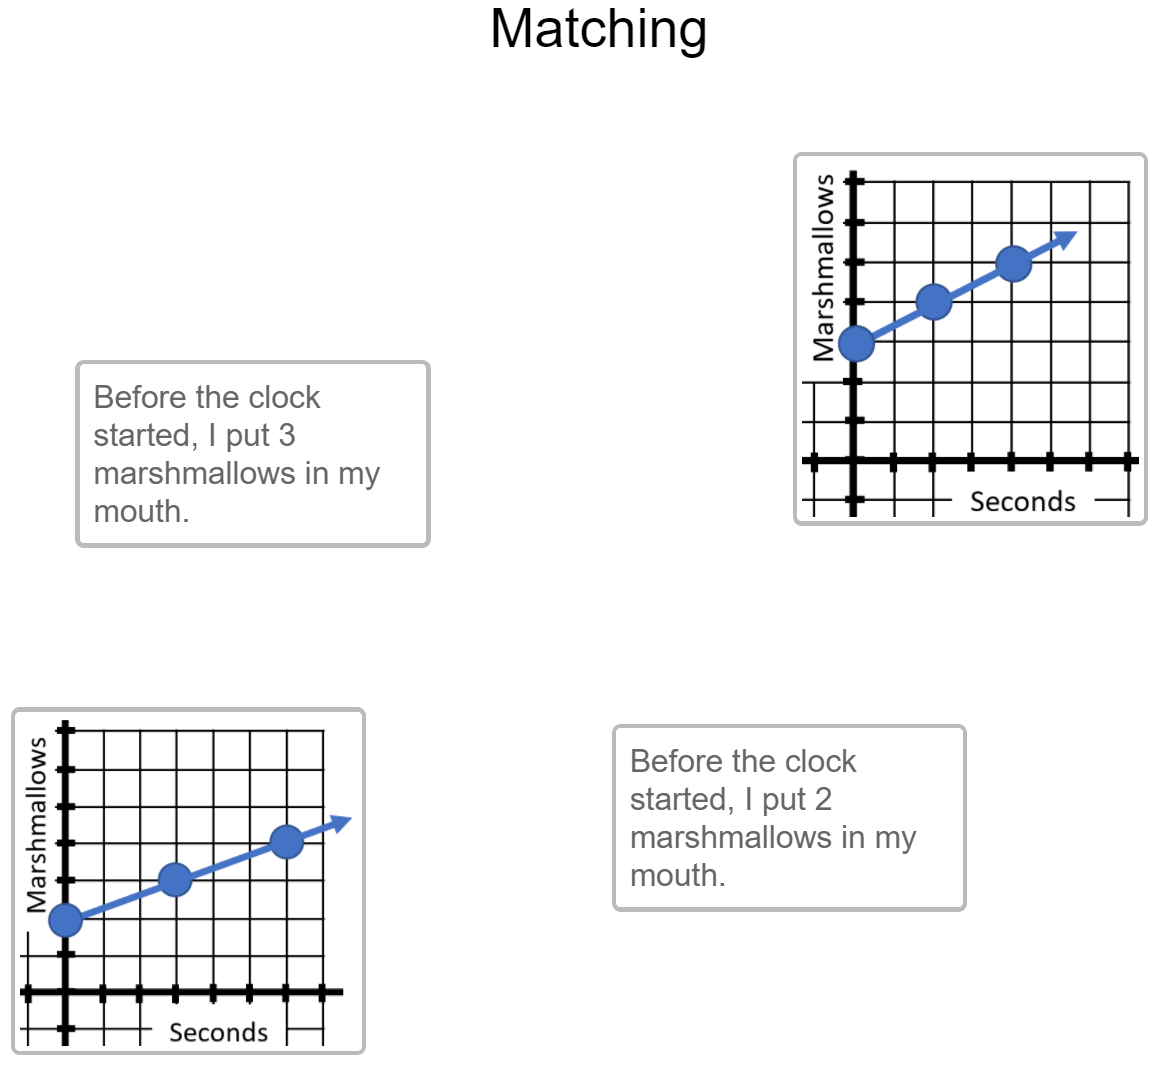
4. practice finding b on graphs
We moved over to the next Desmos activity, which is the meat of the lesson. Its starts right off focusing students on seeing b in a graph.
We confirmed students’ theories by watching the video of the purple graph, and discussing m and b in the video. We were still confused about m but agreed that b=2.
Then it was time for matching graphs with their equations and values of b, starting with easy problems that require almost no knowledge transfer:
And building to more formal questions that require transfer:
5. okay, but what about m?
It was time to revisit m, but they were emotionally done being stuck on it. I needed to get them unstuck. I needed to nudge them without giving it all away. So we watched the video below with the prompt, “which half of the video shows a faster rate?”
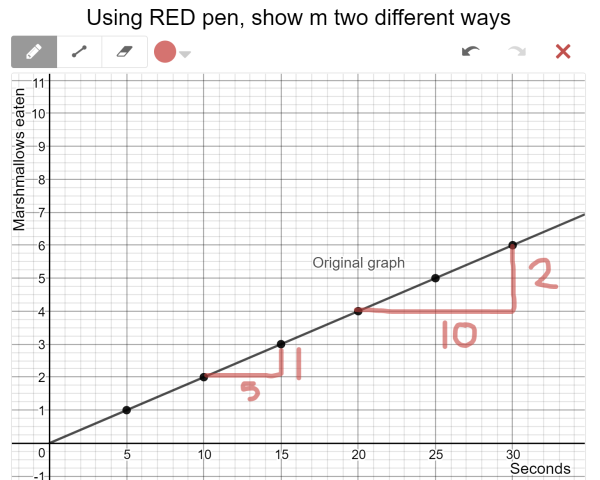
Within a minute or so, everyone agreed that the rates were the same. So you can’t say m=1 in the bottom, because then m=2 in the top, and those are not the same. You also can’t say m=5 and m=10, because those are not the same. You need a way to say the rates that gives the same answer for both videos.
Students discussed in their pairs, and if needed, I gave another nudge: “How do you say how fast anything is happening? Like, how fast a car is driving?” Students arrived at 1/5 = 2/10. I did a live demo of the decimal rate, 0.2 marshmallows/sec, by ripping a marshmallow into 5 pieces and eating 1 piece per second. Yum. We ended by drawing the rates 1/5 and 2/10 on the graph.
This led into student-paced work applying their understanding of m and b. You can see an example here:
Finally, we transitioned to drill practice on slope. For this lesson, we did only positive slopes.
6. links to materials
Here are a bunch of worksheets on seeing m and b in visual patterns. You should use these before teaching the lesson in this post — they’re prerequisites.
Here again is the 1st Desmos activity, which prepares students by focusing on m and b in visual patterns and story problems.
Khan Academy recently created a new “assignments” feature. Instead of using the old “recommendations”, you now create assignments with due dates. Students access the assignments directly from their profile, which is good — recommendations appeared in the old learning dashboard, which many of my students found complicated and intimidating.
These new assignments have some pro’s and con’s, but as always, what I like best is the ability to hold different students to different standards.
Here’s a tool I made to simplify grading multiple assignments at the same time — it totals up the points from multiple exercises into a single number. Then it prints out a little “report card” slip for each kid showing them their score breakdown. It also automatically gives full credit for work done on time, partial credit for work done late, and lets you specify students with permission to turn in late work for full credit (for example, if they have that accommodation in their IEP’s). I am still experimenting with ways to add extra credit that some kids can get credit for and other kids can choose to skip.
I’m kicking off a series of posts on a quadratics unit designed to have a simple narrative arc — one that’s clear enough to allow our weakest students to follow the conceptual plot. The previous post contained the outline of the whole unit. Now we’ll dive into the first lesson.
Dan Meyer has suggested his popular Will it Hit the Hoop as a good launch for quadratics study. And it is good, but the launcher is aimed in the wrong direction. Instead of aiming kids’ attention at vertex form, I think it should set up the transition to factored form. Here’s how the official Desmos version ends by making connections to vertex form:
But if we anchor our unit on factored form instead, we can expose the value of factoring early (and often). That’s great, since factoring is the skill I’m most worried kids will resist. In addition, factored form provides the clearest link between the two halves of a quadratics unit: graphing parabolas, and solving quadratic equations. Without that link, our weakest students might feel the two halves are basically unrelated to each other.
I revised the lesson to refocus it on factored form. Here it is on Desmos, and here’s how it works now:
The goal is to prompt this question: what kind of equation makes a parabola? Here are the last 2 screens of my Desmos lesson:
Hopefully, students are ready to care about zeros of a function, so it’s time for some instruction: we transition to the handout below (pdf version here). Students should NOT have access to calculators for this handout. If they have calculators, they won’t think the tedious problems are tedious, and they won’t start looking for patterns and shortcuts. I want them muttering to themselves. Here’s the handout:
You might have noticed the “Prep” questions at the top of the first page: 8 + (9) and 8(9), and (3) + (2). What’s up with those? They’re designed to remind kids that not all problem with parentheses are multiplication problems. That’s the kind of misconception that can throw our weakest students off track for the whole rest of the lesson. After that little reminder, the key connection between parabolas and zeros happens in #1, part c. That’s where the class substitutes the zeros into the equation and sees why they’re zeros in the first place, and it’s worth some class discussion to flesh it out.
At this point, we could probably start teaching kids how to take a parabola’s zeros at 2 and 5, and create the factors of (x-2) and (x-5). But personally, I don’t think they’re ready for that. Not until they feel in their bones that
(x – 2)(x – 5) is like a having a light saber
(x – 2) + (x – 5) is like wearing stormtrooper armor
(In case you never noticed, stormtrooper armor doesn’t seem to be too helpful to the stormtroopers). The rest of the handout asks a series of simple yes/no questions that gradually reveals the glory of factored form. Hopefully, this understanding emerges organically. Dan is fond of saying that if factoring is the aspirin, we first need students to experience the headache. The tedious addition problems are my headache here, and I actually think they’re a bit more effective than his headache because they’re more tightly connected to the actual concept of factoring.
Even if you disagree with everything I’ve written so far, I don’t recommend the new & improved version of Will it Hit the Hoop.
Folks who read Dan’s work regularly will find the irony here, but I think when Desmos revised this lesson, they added some new fancy tech features that detract from its power. The features help you gather individual student opinions on whether the basketball shots will go in or not (students vote “in” or “out” by clicking on their screens). But this way of voting sucks energy from something that should be a lively and social. In the class where I used them, students silently clicked through their opinions. In the classes where I didn’t, they agonized aloud — together — about where the shots would go. So I recommend not using them. Instead, have kids vote with their feet: move to one side of the room for “In” and another side for “Out”. My version of the Desmos lesson doesn’t have clickable voting.
Next blog post — Lesson 2: “You don’t play with Legos one block at a time”
Update: The official Desmos version does have one great feature my version doesn’t: the videos of the shots going in or out. When I teach this lesson, I just click over to the Desmos version to show the answers for each shot.
If you want to teach for meaning, quadratics are extra hard for a simple reason: the way quadratics are usually taught, students have to plow through weeks of difficult skill-building before becoming convinced that these new skills will make them more powerful. (Dan Meyer would say it’s hard to convince them of their intellectual need to learn quadratics).
I’d like to outline a quadratics unit that makes kids feel powerful from the beginning. It’s a conceptual approach, and for a lot of folks, that means higher-order thinking and “more rigor.” Sorry, but my goal’s a little different: a conceptual approach that will knit topics together so my weakest students feel a coherent narrative arc through the unit.
Here’s a brief outline of the whole thing. Notice that skill-building on multiplying binomials and factoring quadratics don’t appear till Lesson 8. Instead, I am front-loading the big idea of factored form of a quadratic. After all, factoring trinomials feels useless and painfully tedious unless you’re already a believer in the power of factored form. And only after you see what factored form can do will you see expressions like (x+1)(x-2) as important enough to want to multiply them out. Update 11/18/17: Originally, I’d intended this to be a series of posts about each lesson in the unit, but instead I’ve decided to describe each lesson below and link to the materials. Update 5/1/18: I keep improving this post as I think about it. I guess it’s kind of a living document.
1. Will it Hit the Hoop, adapted to focus on factored form. For reasons described in this blog post, I really think quadratics needs to start with factored form rather than vertex or standard form. (After all, factoring is the biggest obstacle to enjoying and understanding quadratics, right?) I rewrote Will it Hit the Hoop, byDesmos, to channel the awesomeness of that lesson to those ends. Check out the post linked above for details.
2. What equations make parabolas (and other nonlinear graphs)? Now we apply factored form to an awesome Desmos marbleslide. The little stars are all zeros of the function, which focuses student attention on the critical features in a really fun way. At the end of the lesson, students even learn to stretch or reflect their graphs to avoid the purple obstacles. Here are a couple thumbnails of the marbleslide:
3. Practice and refinement. Consolidation lesson, with a slight extension:
Part 3.1 Drill practice on the factored form of a quadratic equation. This includes parabolas where the zeros are not integers, so you have to set the factors equal to zero. For example, in (x + 9)(5x – 1), you have to solve 5x-1=0 to find the second zero.
Khan Academy’s quadratics unit begins with factored form, so those exercises are a great resource if you’re into Khan Academy.
Part 3.2 We also need to learn to apply vertical shifts to parabolas. (This may seem out of place, but it’s necessary for the catapult-shooting that we’ll do in the next lesson). One resource for this bit is the last 5 screens of my Desmos marbleslide. They explicitly introduce vertical shifts, and compare them to vertical stretches.
4. Real, actual catapult target practice that applies zeros and vertical shifts. I got this idea from Julie Reulbach, but whereas her activity is for Precalc, you can successfully adapt this for Algebra 1. The idea is to place a projectile launcher on the floor and notice the landing spot. If, say, it’s 70 cm away from launch, then y=ax(x-70) is a good approximation of the parabola, measuring distance from the launcher. You can eyeball the height of the vertex while it’s flying, adjust the value of a on a Desmos slider, and graph the actual parabola. Which lets you predict: if you launch it from a tabletop instead (introducing a vertical shift like we studied in Lesson #3), where will the projectile land? Here is a catapult design students can make — I tried a cheap store-bought one last year but wasn’t satisfied with the repeatability, so I think I’ll try to obtain the expensive model featured in tweet below:
Physics works! Thanks to @ScotHovan for this practical. They get x, y, and angle for full lunch, need to predict y for their x. pic.twitter.com/AYYkH3m2XL
*Note: I think you can do Julie’s projectile lab without the LabQuest interface, which saves serious $, but then you need to buy the $11 power supply for the projectile launcher.
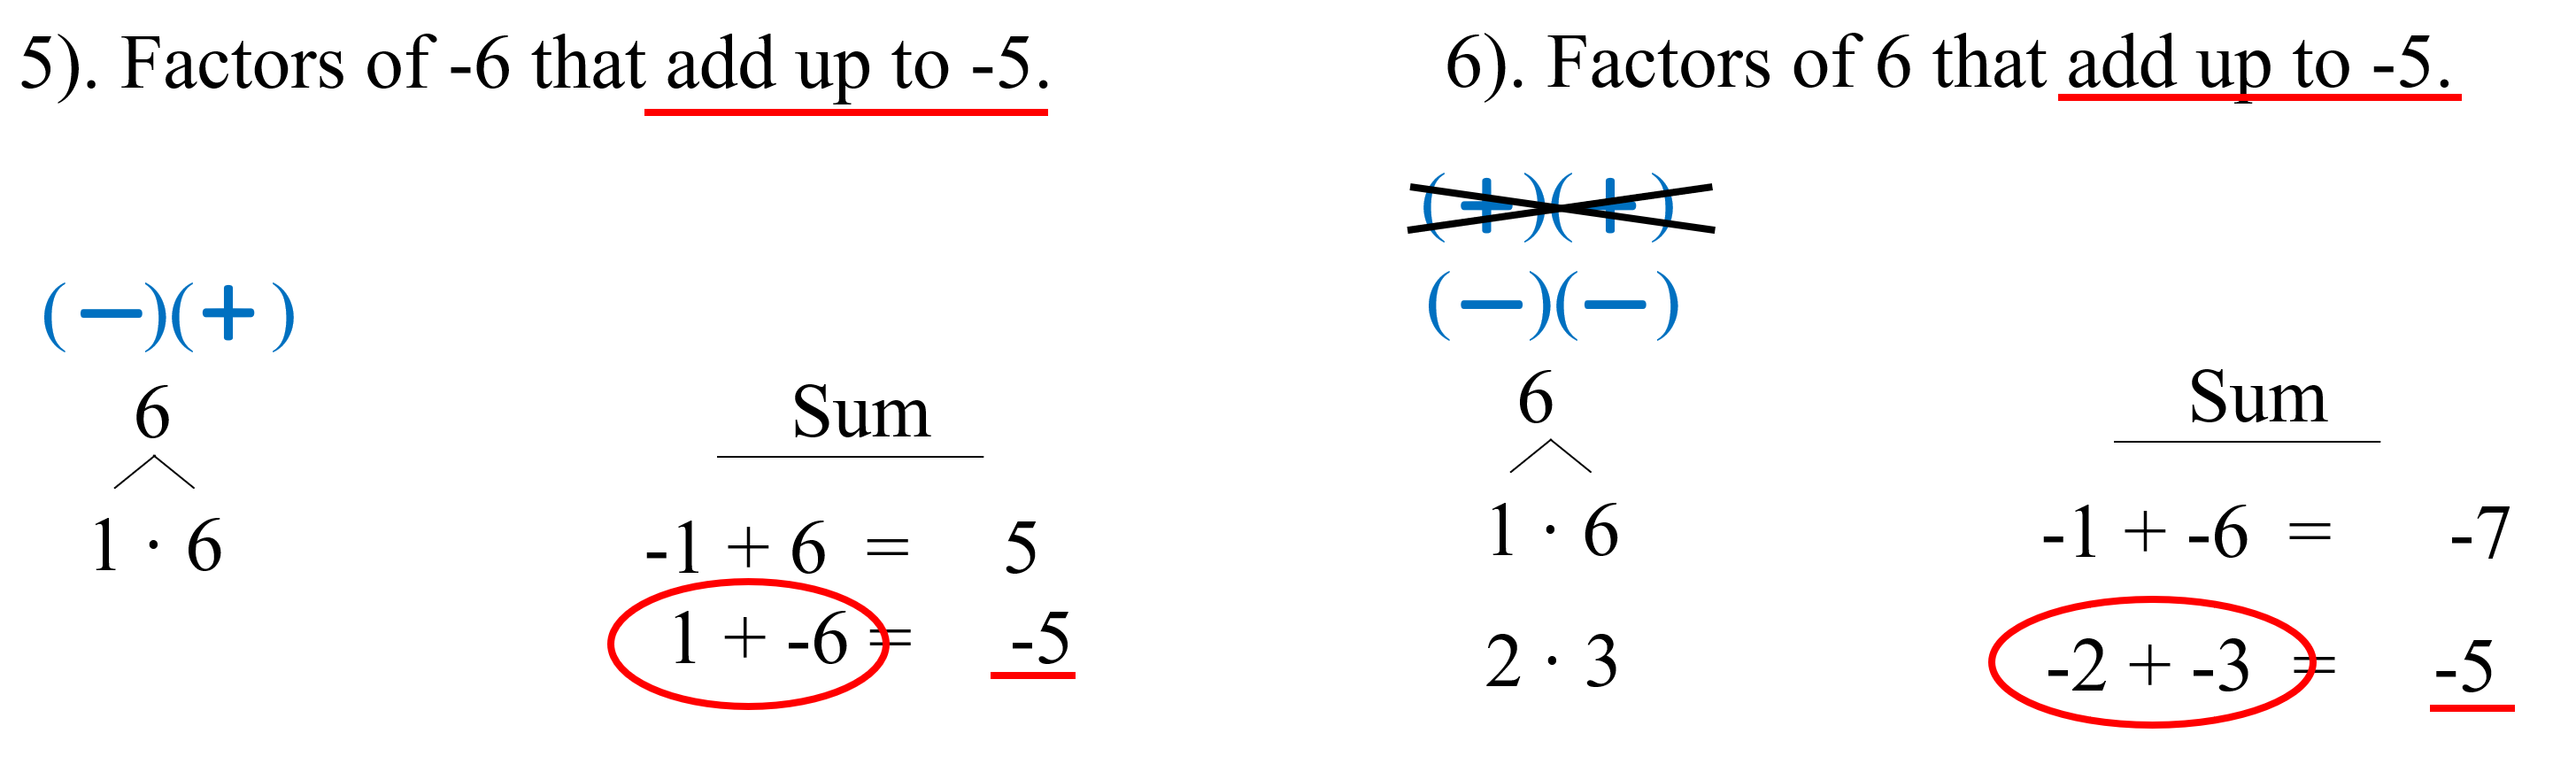
6. Random skill interlude: finding factors of one thing that add up to something else. This is a boring topic, but I have a couple of honestly excellent lessons on this. For students who don’t know their multiplication facts, this skill can be quite difficult without careful lesson design.
Here is my second lesson, introducing negative numbers, which are really the crux of students’ difficulty with finding factor pairs. Here is the student handout for this lesson. My secret trick here is to include lots of contrasting cases where the problem can almost be done in two different ways, using either two negatives or one negative and one positive, but one of those methods gives the wrong sign for the product. It turns out this is the key difficulty to hammer home repeatedly, even ad naseum, until everyone understands. Getting kids over this hurdle addresses about 50% of their difficulty with factoring. Here’s a screenshot of the lesson showing what I mean. Notice that the problems are almost the same: one product is -6 while the other is 6, but both problems add up to -5.
7. Skill-building on factoring and multiplying binomials. There are a million blog posts out there on factoring, but there’s one little thing I do that seems to make it better for weaker students. I teach factoring when a>1 first, with the box method, and then teach a=1 as a special case to students after they show they can handle the a>1 case. Making the transition in this direction seems to be much easier than in the reverse direction.
8. Introduction to Standard Form: When you multiply binomials, the x2 represents the acceleration. The lesson is adapted from one I’ve already written about here. The Desmos activity linked within the post is the key that brings it all together — kids are always successful discovering the correct way to rearrange the dots into a square to calculate the the total number without adding them up.
Note: This used to be my lesson 7. But as I continue tinkering with this quadratics unit, I’ve realized the key content of the lesson is the different role that the quadratic and linear terms play in standard form. So I think this is best as the intro to Standard Form.
9. Traditional quadratics topics, e.g., the quadratic formula, graphing parabolas using the vertex formula, etc.
For years I’ve been rearranging the pieces of my linear functions unit like a jigsaw puzzle, trying to optimize comprehension for weaker students. Weaker students see math as a giant bag of disconnected steps to memorize, right? Changing that can require a cultural shift in the classroom that I’m not usually able to pull off. It’s not that student engagement is so hard — there are lots of tasks that kids get excited about. But while those tasks might motivate kids to learn something like slope, they don’t always help kids internalize what slope really means.
And even if you can give them an aha! moment today, it may be lost by tomorrow. In fact, it probably will be. Once you introduce the slope formula, slope becomes that formula. It barely even matters if today’s lesson created a nice footpath in students’ brains between “slope” and the change in one quantity per unit of change in another. Once that formula comes out, your measly footpath is no competition for the 8-lane highway that’s opened up between “slope” and (y2–y1)/(x2-x1).
If the intuitive meaning is going to compete at all, you’re going to have to write a lot of drill and assessment questions that force students to traverse that footpath over and over until students notice what nice scenery it has.
Here’s a screenshot of the key question type I’ve developed to make that happen:
Here’s what I love about this question type:
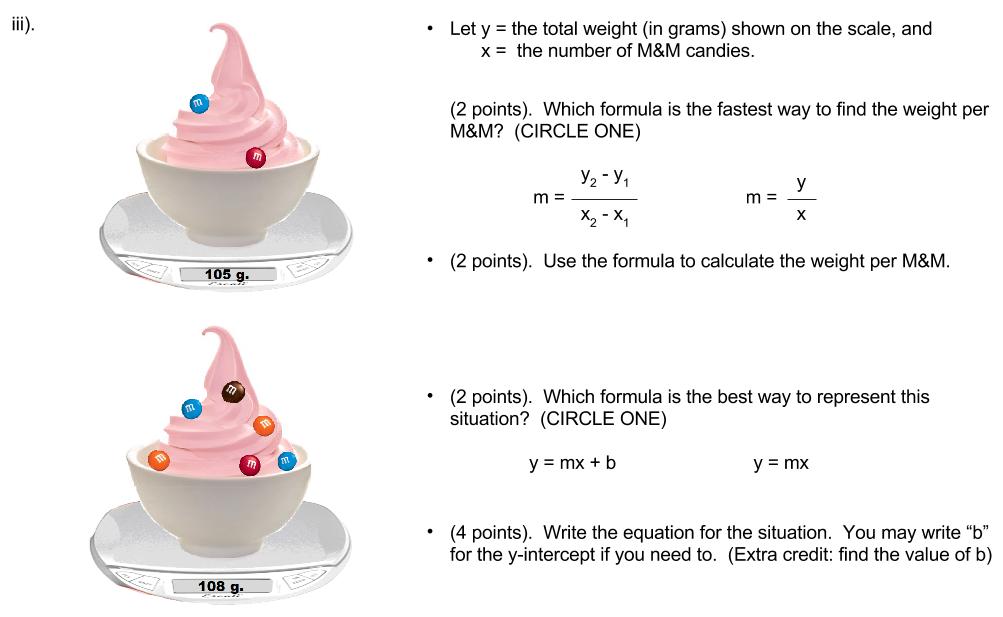
You can visually interpret why m = y/x doesn’t work when the y-intercept isn’t zero. In the top picture, y/x would be 105/2=52.5 grams. Does each M&M weigh 52.5 g? No, because 52.5 g would represent 1 M&M plus half the fro-yo. On the other hand, if you just had a bunch of candies on the scale without any fro-yo, y/x would make perfect sense.
This question imposes a time cost to missing the conceptual point, but still allows students to get the question right if you don’t get the concept. If you really can’t tell whether something’s direct variation, you can always divide y/x for both examples and see if you get the same answer both times. (Sadly, that’s mainly what my state wants kids to learn about direct variation: that given a table of values, you should divide y/x and see if you get the same answer for all the ordered pairs). There will always be a few students who need to do this. But it’s much faster to notice visually that this example is not direct variation because there’s a non-zero y-intercept: the fro-yo. So I’m teaching what the state wants me to teach, but allowing students to use comprehension as a shortcut if they can see it.
You can even visually interpret why non-direct variation scenarios give you different answers to y/x. In the top picture, 105/2 represents 1 M&M and half the fro-yo. In the bottom picture, 108/6 represents 1 M&M and just one-sixth of the fro-yo. Kids can see that it should be a smaller answer.
Repeated practice with this question type causes students to associate m=(y2-y1)/(x2-x1) and y=mx+b with each other, and m=y/x and y=mx with each other. I want that association.
Soooooo, drumroll please, I now present my new linear functions unit outline:
Linear dot patterns.
The focus is on noticing which part of the pattern is repeating, and which part is staying the same, and what to do with that information. We don’t use the words “slope” and “y-intercept” yet.
Note: some dot patterns should be direct variation. Direct variation patterns can even be tricky by having 2 parts to the pattern that both repeat:
Linear story problems. These are your usual algebra story problems: a tree was 4 ft tall when it was planted, and it grows at a rate of 1.5 ft per year. Students have to interpret key words that indicate initial value or rate of change. Here we use y=mx+b, but not the words “slope” and “y-intercept”. Instead, students use their own words to describe what the m and b mean.
Linear graphing stories. I lead off with some of Dan Meyer’s graphing stories (Kenneth Lawler’s bench-press and Adam Poetzel’s Height of Waist off Ground), focusing on how the starting value shows up on the graph as the y-intercept. Then we do my own chubby bunny lesson (video below) which is more geared toward slope-intercept form. Now that rate is showing up as steepness on a graph, and the starting amount is showing up on the y-axis, it’s okay to start calling them m the “slope” and b the “y-intercept”.
Slope from 2 points, conceptually, which explores the concepts shown in the fro-yo question above. Here is my slope-from-2-points lesson. I do it as a Pear Deck lesson now, but at some point will probably convert it over to Desmos now that Desmos has the classroom conversation toolkit. After this I start giving questions like the fro-yo assessment question.
A slide from my slope-from-2-points lesson
Identifying proportional scenarios. Given a scenario, can students identify it as a proportional or non-proportional situation?
Here’s a screenshot of this question type:
The idea here is to combine “Graphing stories” with “Slope from 2 points, conceptually.” The multiple choice graphing question scaffolds kids’ thinking, but it’s not just a crutch: it also improves learning by signaling to kids that the most important thing is to use common sense to tell whether the y-intercept would be zero or not. So in the question above, would a pizza with zero toppings cost $0.00 ? Compare this to the current Khan Academy exercise on identifying proportional situations:
Screenshots of some of the Khan Academy problems
Slope-intercept form formalism, including the all the goodies we need kids to know: graphing lines given in slope-intercept form, applying the formula for slope to random pairs of points, etc. My kids need lots of focus on distinguishing between y=2x and y=2+x, and also y=2 or x=2. Yours, too, right? The formalism can also include some more advanced work on slope and direct variation.
I’m very hopeful that at each phase of this unit outline, I’ll be able to ask quiz questions that check real comprehension of the meaning. And for a certain type of kid, if it ain’t on the quiz (and the quiz after that, and…), then you never really taught it.